back to top
Home Blog Page 21

Test Series Review: New Zealand vs South Africa 2022

It was a series of twists and turnarounds. Story of ruthless domination by New Zealand and then a fiery comeback by the Proteas Lineup.

South Africa was touring New Zealand for a series of 2 Test Matches, to a country that has never won a single test series against them, either home or away. 

Although New Zealand has an edge in this series, their team is much better on paper, especially if we look at it from the conditions-oriented viewpoint, and with both the matches being played on the Hagley Oval (lost 1 in the last 10 tests), their chances are considerably higher. 

However, South Africa’s recent Test series win against India and Ban’s beating New Zealand, gave SA the conviction to keep their undefeated tally existing.

The unavailability of Williamson, their lead batsman and captain, and Boult, their essential weapon in fast bowling, has also given South Africa a chance and laid the path for a compelling series. 

So the motto is simple: A team is playing with the pressure of saving history; another, with the hopes of creating it.

1st Test: Who missed Boult? Maybe SA

NZ won the toss and elected to bowl first, on a pitch that has everything for bowlers.

Matt Henry, a genuine swing bowler made to play in such circumstances, arrived into the playing 11 to fill the vacant spot of Boult.

The contest started with a swinging leg-side delivery by Southee. It gives a glimpse of the swing available on this wicket against a batting lineup that is not tested much in these conditions.

New Zealand bowled out South Africa at 95, 1st test, 1st day, 1st innings and New Zealand are right at the top of this match. South Africa needs a miracle to win it from here, but miracles won’t happen daily. 

Henry was the ultimate reason for that triumph, as he delivered a typical swing bowling masterclass, 7/23.

As usual, the pitch started to receive questions from cricket pundits on social media. 

On the same pitch, the batting set of New Zealand has scored 482, even without their best batsman not playing, and their most experienced batsman and the most in-form, scoring 15 and 35 respectively.

Henry Nicholls scored his 8th Test century and was involved in some decent stand with Wagner(49).

CDG as typical, scored a Quickfire 45 in 42 balls, and then Henry made this day even more special by being the first batsman to score a test 50 (58*) at No.11 and take a 6w haul in the same match.

482/10, almost 5 times more than SA Total, and SA now have to score 387 runs, not to win the match, just to make NZ bat again, to survive an innings defeat.

A rock-solid start becomes a crucial requirement at this point, The score of the Top 3 in the innings is 0,0,2. Quite rock-solid!!

Southee took the last wicket of Glenton Stuurman to grab his 14th 5w haul in Test cricket and his 202nd wicket in NZ surpassed the count of Sir Richard Hadlee (201).

The match is officially over here, SA was dismissed for 111-10, and they lost the match by an innings and 276 runs, simply a humiliating defeat.

No positives have emerged from their side; their batting failed miserably, their bowling didn’t go well, and even their fielding was not up to the spot. 

Henry got the Man of the Match; New Zealand didn’t miss Boult, but cannot articulate the identical for South Africa.

With this triumph in the Test, Latham and Co will come into the second test with a lead of 1-0, and they are ahead, a step has been taken to rewrite history.

Important Points/Stats:

  • Since the start of 2019, out of the 20 matches on NZ soil that have produced results, NZ has won 9 matches by an innings margin.
  • For the first time in their Test history, South Africa got all-out under 100 runs against New Zealand.
  • This was New Zealand’s first test victory by an innings against the Proteas. 
  • 205 is the Lowest Score of South Africa after losing all 20 wickets in a test match against New Zealand. The previous lowest was 419 runs, more than double.
  • Matt Henry, as previously stated, became the first No. 11 to score a half-century and take a 6w haul in the same match.

2nd Test: A Remarkable Comeback

Both captains came to the toss at the same venue as that of the 1st Test; Africa won the toss, and Elgar took to bat first, even after their spectacular batting exhibition in the prior match; that decision at that glimpse of the moment looked surprising.

The 1st session thoroughly changed the viewpoint of looking at that decision; the wicket was offering comparatively less movement. Neither perfect bounce was present; numerous deliveries got carried to the keeper even in the 1st session.

As a result of these elements, SA managed to get an opening partnership of 111 runs, equal to their best team total in the 1st innings.

Erwee arose as the champion from the Proteas lineupThat’s what Proteas fire is“. In the second test match of his career, he scored 108 against a terrific fast-bowling attack.  

While others didn’t manage to score big, however, 5 scores more than 30 (no one scored a fifty among them) laid the foundation for a more than a good aggregate of 364, not a mountain-size one looking at the pitch and because they were 199/1 at the moment. Yet it was enough to fight, adequate for the bowlers to bowl with soul and intention, sufficient to keep the odds alive.

Their batting clicked, and their bowling did precisely better by dismissing 5 players, at the score of 91. Yes, half of the team goes back into the dugout at the moment where 273 runs are required to match the opposition total. SA is ahead, ahead by a decent margin at the moment.

Mitchell and CDG, the last 2 players remaining (who were playing on their batting capabilities), disappointed South Africa by trucking a partnership of 133 runs before Maharaj dismissed Mitchell at 60. 

CDG- when he plays in full flow, looks so satisfying to the eyes, scoring his 2nd Test century after being stuck in the 90s for around 50 minutes. 

NZ finished at 293; CDG remained not out. It was a wholehearted inning by a player whose career was on the decline for the last 1-2 years.  He has recreated many vital knocks for NZ at critical junctures.

Coming into the match again, South Africa had a lead of 71 runs going into the 2nd innings.

Their primary aim is to cross 300, although to turn the match in their favour, they have to ensure a target of at least 350.

They began, as usual; their top order failed. Southee ripped apart both openers by the score of 23. This series was a nightmare for, South African Skipper (55 runs), can say this for all the opening batsmen. Baring Erwee and Elgar’s opening stand, in the first innings of the second test, the openers scored 59 runs in 12 innings.

Southee’s improvement since 2018 is just remarkable, even though Test cricket has become much more bowling friendly since that time; still, the progress is more than just what an average bowler has enhanced since then.

Henry then delivered a ripping Yorker to get rid of Markram (14); his form has been on the low side for a year now, and his runs are not coming (153 in the last 12 innings,). The good thing is that he is just 27 years old and will only improve from here.

The partnership between Bavuma and Rassie went well before Neil Wagner: The Partnership Breaker for NZ got both of them inside the span of 6 overs.

Wiaan Mulder, a bowling all-rounder, came to bat with Kyle Verreynne, a guy who has a great first-class record in South African Domestic Cricket, but in the 8 Test innings in his career so far he has never crossed the score of 30 even once.

They both struck a partnership of 78 runs, Kyle got his first test 50 and then converted that to his first test 100. Mulder scored a crucial 36. Rabada played an absolute gem worth of an innings. His 47 runs in 34 balls were the reason, NZ’s chances of winning this Test are practically over.  

In between Rabada and Mulder, Jansen got out at 9 to a spectacular grab by Will Young near the boundary rope.

Kyle stands till the end alone; sometimes it is required to stand out from others. He played an innings like… No need to go way back in time for that, the dots of his innings can be connected to the innings of CDG in this match. 

Elgar declared the innings at 354/9, giving NZ a target of 426 in roughly 130 overs. 

Rabada then delivered a fiery opening spell and dismissed both openers inside 13 balls in this inning; Kiwis are now 6/2. It was an unsatisfactory series for both skippers; Latham scored 16 runs in 3 innings.

Maharaj, even though we didn’t talk about him in this article, has performed quite well with the bowl (his 36 was also crucial in the 1st innings).

He clean-bowled Henry Nicholls at the score of 7, and Mitchell at 24 (almost an unplayable delivery: pitched on the line of off-stump and just turned enough to beat the edge and dismantle the bails) to make things even worse for New Zealand.

At the end of Day 4, NZ were 94/4 with Conway, who was hoping to convert his gritty knock of 60 runs to something bigger, at least a century; he has to play a major role to decide the fate in the end.

Blundell, who just opened his account with a single on the last ball of Day 4, is playing with him.

The chances of a win are practically open for one team only; this game ended as a draw, and will be nothing less than a win for New Zealand.

Their task is just to survive the 90 overs; on the other flip, South Africa will be aiming for 6 wickets.

The 1st Session of Day 5 just witnessed a single wicket, but that was the most important one; Simpamla bowled a terrific spell, and in the end, he got his reward. Conway fell just 8 runs behind his well-deserved century.

The centurion in the last innings from New Zealand came to the crease. He survived a huge LBW shout on the second ball he faced.

Now, after the dismissal of Conway, all the hopes of NZ fans have shifted towards him and his partner.

Blundell started in the 1st session quite positively by hitting 2 boundaries in the over of Jansen. He is playing on 44* and now the only realistic hope of NZ rescuing this match lies within this partnership.

And that realistic hope just lasted for 15 deliveries in the 2nd session. Jansen took him on the short ball, with the catch being taken by the team’s best fielder, Bavuma.

Jansen was breathing fire from the start of the 2nd session; he dismissed CDG in his next over itself, and Jamieson after a tiny gap of around 5-6 overs. Again both the wickets on the short ball.

The match was practically over at this point. You cannot expect the bottom 3 players to survive a session and a half; Southee then just started swinging his bat here and there and then while doing the same, he got out to a well-directed short ball by Rabada.

Then due to the disturbance caused by Rain, an Early Tea has been taken. Just after that Tea break, in the 2nd over (94th of NZ innings), Maharaj bowled a bowl pitching between the middle and the off stump, going straight to hit the pads of Matt Henry. 

The umpire picked his finger up, and then Henry reviewed it, just for the sake of formality. That review didn’t change the fate and the match is now officially over. New Zealand got out to 227, their third-lowest all-out score at this venue. South Africa won the match by 198 runs.

Elgar and Co prevailed to keep their history alive; South Africa still didn’t lose a single test series against the Blackcaps.

Kagiso Rabada won the Man of The Match Award for taking 8 wickets and scoring 53 runs in this match.

Important Points/Stats:

  • Kagiso Rabada now has 7 MOM awards in his 52-match Test career; among the active fast-bowlers, only Broad(10) and Anderson (8) are ahead.
  • Sarel Erwee and Kyle Verrynne both scored their first test 50 in this match and converted it into their first test hundred.
  • The margin of 193 runs is the biggest defeat margin (in terms of runs), in the last 15 years for New Zealand at Home.

That’s the end of our test series report for the South Africa Tour of New Zealand 2022. Hope you all liked it.

Don’t forget to share your opinions in the comments section and also share this article with your friends.


South Africa All Time ODI XI

South Africa Cricket has a great history in the longer formats of the game, and that is well known.

However, many do not know that they have the highest win percentage (61.29) in the history of ODI cricket too, excluding associate nations.

Even after entering so many World Cups as favourites, they failed to taste the sweetness of lifting the cup, even for a single time.

Heavily thrashed by luck (as most of us say) in their first World Cup, Wrong Team selection cost them the 1996 WC, and the 1999 and 2015 WC cases need no introduction.

The 1998 Champions Trophy is the only ICC trophy they have on their shelf.
Apart from all these Team achievements, South Africa has produced great players in this format of the game.

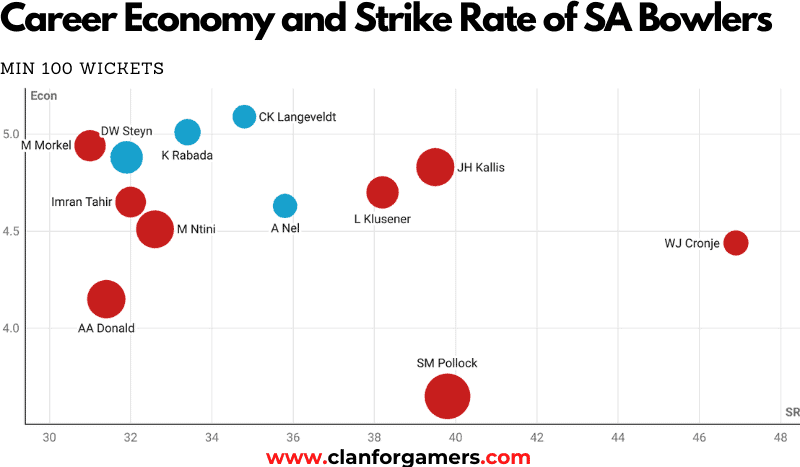
The likes of AB de Villiers, Shaun Pollock and Lance Klusener are also in contention to be part of the All-Time ODI XI, which makes them an automatic pick in South Africa All Time ODI XI.

What are the other names in the XI except these three? Read this article for the complete answer to this question.

Hashim Amla

As cool as Ice and as solid as RockThe first word that comes to mind after listening to his name is “Underrated”. His ODI career can be considered a synonym for that word.

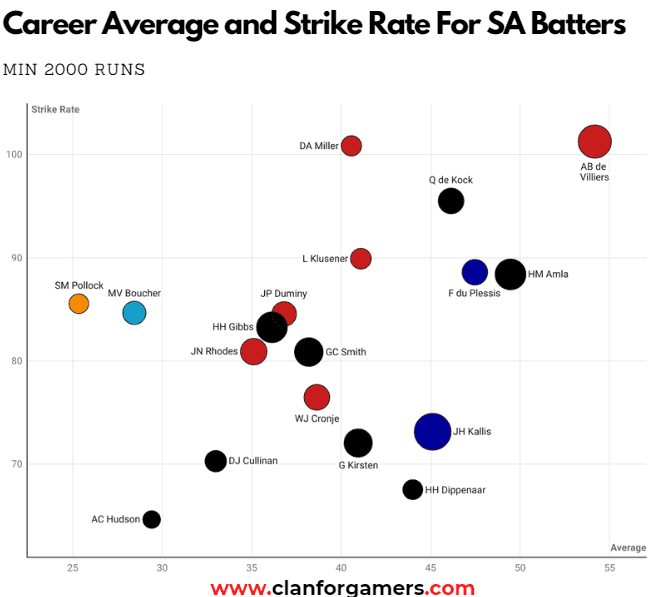
Having a reputation as a Test specialist among some fans, Amla’s career ODI average is higher than his Test average; that too by a margin of 3 with a healthy strike rate of 88. 

Fastest to reach 2000,3000,4000,….,7000 runs in ODI cricket and along with them, he was the First South African Player to score 25 centuries and no one in the world has achieved this faster than Amla, 151 innings.

His innings against Pakistan in 2010, sum up his gritty character, where he scored 119 runs and all the other batsmen scored less than 100 combined against a Bowling Lineup of Akhtar, Razzaq, Ajmal, Riaz and Afridi. The importance of that innings can be justified by the fact that South Africa won that match just by 2 runs.

Quinton de Kock

South Africa has produced many great openers in ODI cricket such as Graeme Smith, Garry Kirsten, Herschelle Gibbs etc.

Quinton is as good as any name mentioned above (if not better) for the opening slot, and the fact that he provides great skill in the wicket-keeping department is also a reason why he got picked above those names.

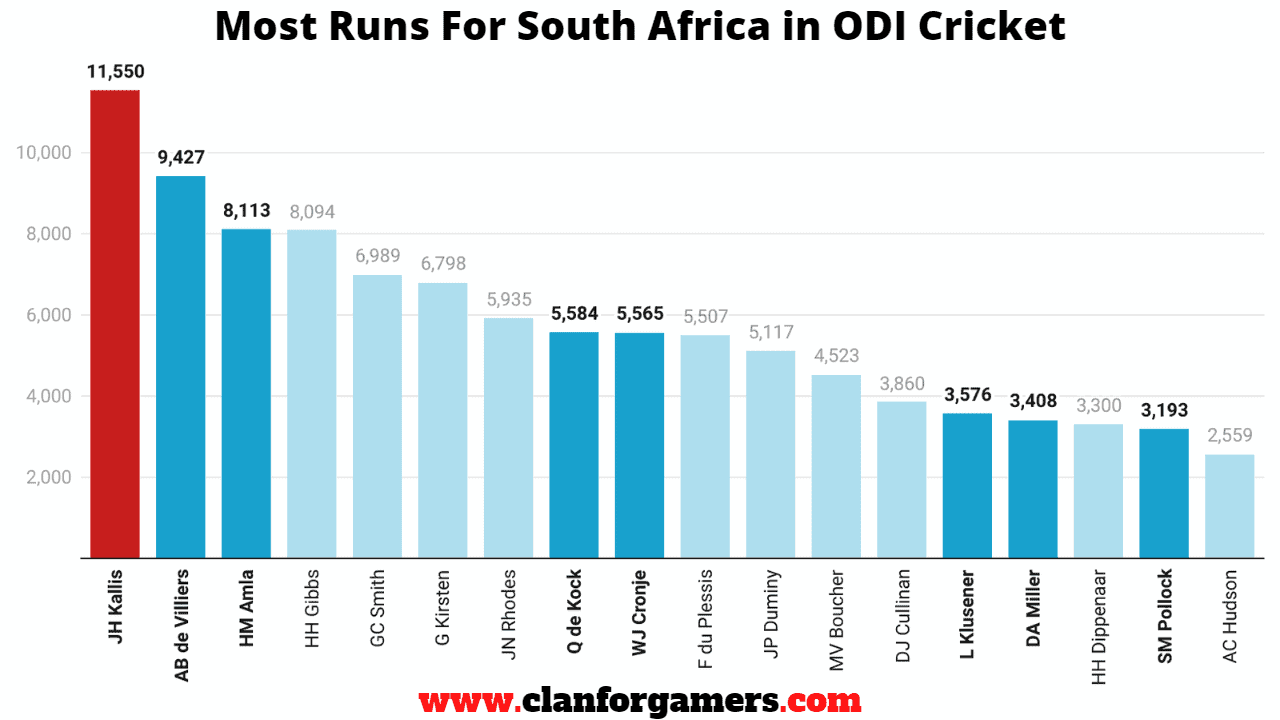
He has scored 5584 runs in his ODI career so far, with an average of 46 and a strike rate of 95.

Quinton de Kock is the only active cricketer in this team; being just 29, he has at least 4-5 years remaining in international cricket.

Jacques Kallis

Even though his ODI career was just a shadow of how great his Test career was; still, that shadow is enough to secure him a place in South Africa’s All-Time ODI XI.

11579 runs with an average of 44.36 with a moderate strike rate of 72.89. Along with that, Kallis has more than 250 wickets (273) to his name with a decent average of 31.79, which means he also adds a decent bowling option to the team.

So he can bat as much as a regular batsman, can bowl even 10 overs if required, and not forget that Kallis was a great slip fielder too. So, A complete package.

AB de Villiers

He is simply the greatest ODI batsman from South Africa by a notable margin.

As good as anyone in modern-day cricket, Mr 360 was the name that revolutionized ODI cricket. 

His numbers are pretty great, with 9577 runs with an average of 53.5 and a strike rate of 101.1, with 25 100s to his name.

AB de Villiers can be considered a synonym for the Ideal ODI Batsman, performed in almost all countries against all the opposition; even in the Biggest sporting event of cricket, “ODI World Cup”, he has an average of 63.52, the highest in the history for a batsman with over 1000 runs.

Hansie Cronje (c)

The man who gave a reputation to the South African team since apartheid. Many will know him because of his name in fixing scandals; but even before that, he left a significant impact on South African Cricket, especially in ODI cricket.

Cronje was almost a complete all-rounder in this format; a decent batsman with 5565 runs with an average of 38.65. (Strike rate: 76.48), a good fielder as most of the players in this country. 

His medium-pace bowling was quite good, 114 wickets with an average close to 35, signifying that he was at least an average bowler who could bowl when required.

Now, if Cronje’s skill set of Batting, Bowling and Fielding was not enough, He was also regarded as one of the best captains in cricket history, especially due to his on-field tactics. 

South Africa won 99 matches (out of 138) under his captaincy, a win percentage of 73 (The third-best in the history of ODI cricket). Also, South Africa’s only ICC trophy win (1998 Champions Trophy)  came under his captaincy.

David Miller

Only two batsmen in South African cricket strike above 100 in ODI cricket; one of them is batting at 4 in this team, and the second will bat at 6.

David explosive Miller, even though he is generally inconsistent in this format, has scored 3408 runs with an average of 40.57.

His dynamite nature, ability to win matches single-handedly on his day, and gun fielding make him a default pick in this XI.

Lance Klusener

He is simply the definition of a complete all-rounder in One Day Cricket. 3576 runs with an average of 41.1, and that too, with a strike rate of 89.92, are just great numbers for a finisher in 96-04.

Explaining how good he was, even regarded as a bowling-all-rounder, he could be a part of this team, just on his batting skills.

192 wickets with an average of under 30 with an economy of 4.7 can be termed as a massive addition to his records.
In the 1992 World Cup, Lance gave one of the best individual performances in the tournament’s history. His 281 runs with an average of 140 and a strike rate of over 120 need no explanation, except that he was also the highest wicket-taker for South Africa in that WC, 17 wickets @ 20.59.

In the 6 matches South Africa won in that WC, he won the Man of The Match award in 4, including three consecutive MOMs, which completely sums up the reason why he became Man of The Tournament in the 1999 WC.

Shaun Pollock

If Klusener was one of the best all-rounders in One Day Cricket, Shaun Pollock also came in the same bracket.

However, unlike Klusener, Pollock was a bowling all-rounder, taking 393 wickets with an average of less than 25. Along with that, Pollock has the best ERA-Adjusted Economy among all the bowlers with 200+ ODI wickets; that is the reason why he is among the Top ODI Bowlers of All Time.

With being so good in the bowling department, Pollock had decent batting ability, he could save the team from a deadly collapse and also knows the art of finishing well with the bat.

3000 runs with an average of more than 25 and a strike rate of 87 are enough to justify this point.

Allan Donald

Sheer Pace and Consistent Line & Length with an action that is as smooth as silk. The “White Lightning” name was given for a reason to him. 

272 wickets with a bowling average of 21.79, and he has the highest Z-Factor Value for average in ODI cricket among bowlers with 200+ ODI wickets.

Donald is also the only fast bowler to have an away average of under 20 (minimum 150 wickets) and an average of under 27 in all the countries he played in (under 25 except SA and WI).
Donald and Pollock will be taking the new ball for our team. What a delightful sight to watch.

Makhaya Ntini

Ntini will be the first change bowler in our South Africa All Time ODI XI.

With the extreme pace and an action that is too hard to portray, he has grabbed 266 wickets with an average of 24.66 and an economy of 4.5.

During the Famous Australia tour of South Africa in 2006, Ntini enjoyed 2 of the most famous (or best) moments of his ODI career, 6-22 in the second ODI and that 1*(1)  in maybe the greatest ODI match of all time.

Imran Tahir

South Africa doesn’t have a history of producing great spinners, which can be associated with the fact that no spinner has ever taken 100 ODI wickets for them except “Imran Tahir”.

Tahir took 173 wickets with a bowling average of less than 25; he was way apart from any other spinner SA has produced in this format.

The Fastest African Bowler to reach the 100 wickets mark; Tahir, even when he was famous for bowling attacking lengths, has an economy of 4.65, which is quite good considering the era he played.

So, Our South African All Time ODI XI is:

  1. Hashim Amla
  2. Quinton De Kock (wk)
  3. Jacques Kallis
  4. AB de Villiers
  5. Hansie Cronje (c)
  6. David Miller
  7. Lance Klusener
  8. Shaun Pollock
  9. Imran Tahir
  10. Allan Donald
  11. Makhaya Ntini

That’s it, we have discussed all 11 players and the reasoning behind their selection ahead of some other players. You can mention your South Africa All Time ODI XI in the comments section.

Don’t forget to share this article with your friends on different social media platforms.

Ranking The Top 8 Test Batsmen Of This Century

Following our series on Test Cricket, now we are here with our next article on ”The Top 8 Test Batsmen of This Century”

Officially, we have not named this series; but you can relate this as a Series because of our previous articles on Fast BowlersOpeners Etc.

As we are discussing ”The Greatest Test Batsmen of The Century” we have got a problem of plenty. Many players from each of the test-playing nations performed up to the mark.

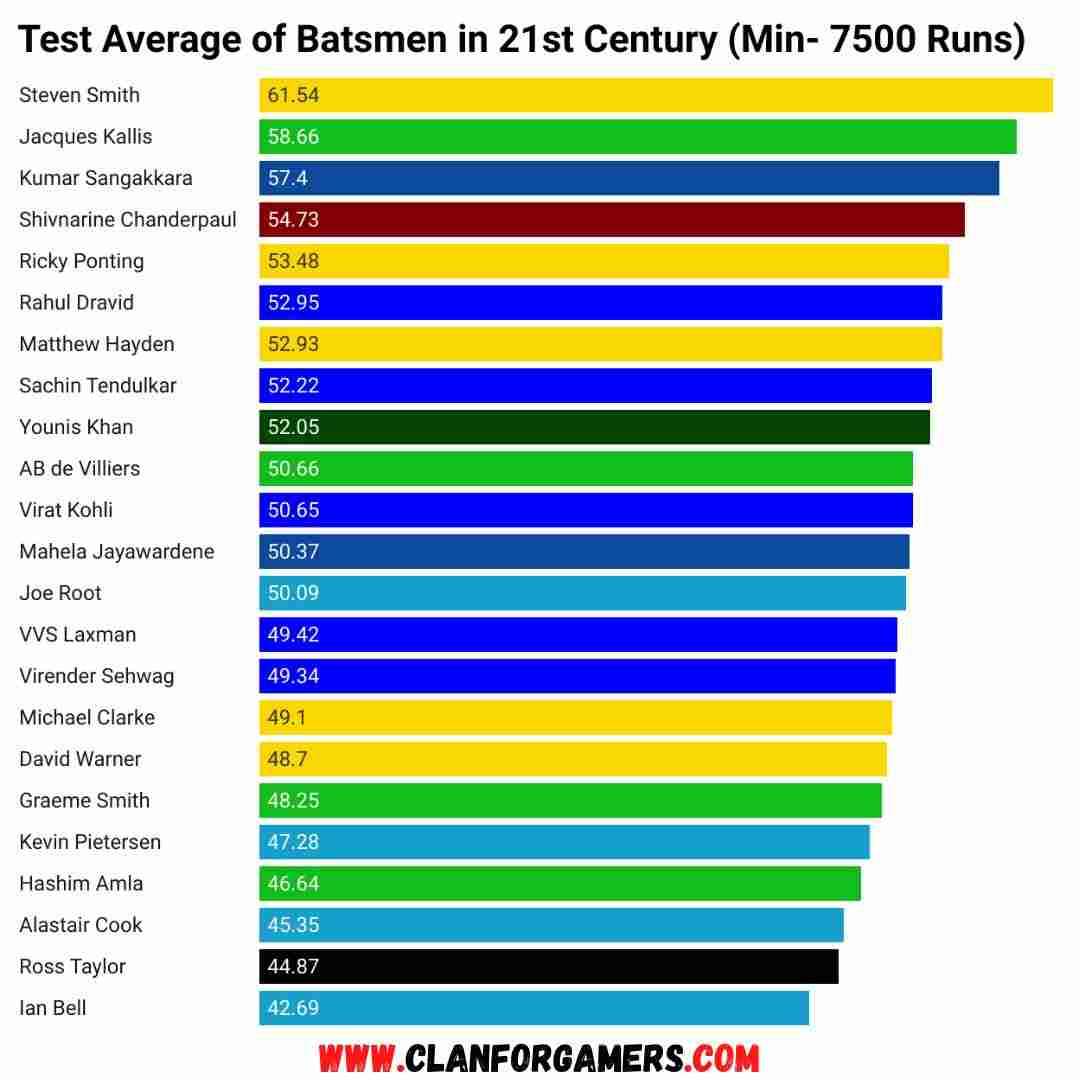
So to reduce the problem to an extent, we have taken only those players who have scored 7500+ runs in the century.
There are a total of 23 players for the same, these are: 

  • Alastair Cook, Joe Root, Kevin Pietersen, and Ian Bell from England
  • Kumar Sangakkara, Mahela Jayawardene from Sri Lanka
  • Jacques Kallis, Hashim Amla, Graeme Smith, and AB de Villiers from South Africa
  • Ricky Ponting, Michael Clarke, Steven Smith, David Warner, and Matthew Hayden from Australia
  • Rahul Dravid, Sachin Tendulkar, VVS Laxman, Virat Kohli, and Virender Sehwag from India
  • Shivnarine Chanderpaul from West Indies 
  • Younis Khan from Pakistan
  • Ross Taylor from New Zealand

The most important factor to judge cricketers is their stats, and for our article on ”The Top 8 Test Batsmen Of This Century”we have taken 5 statistical factors; These are:

  1. Total Stats
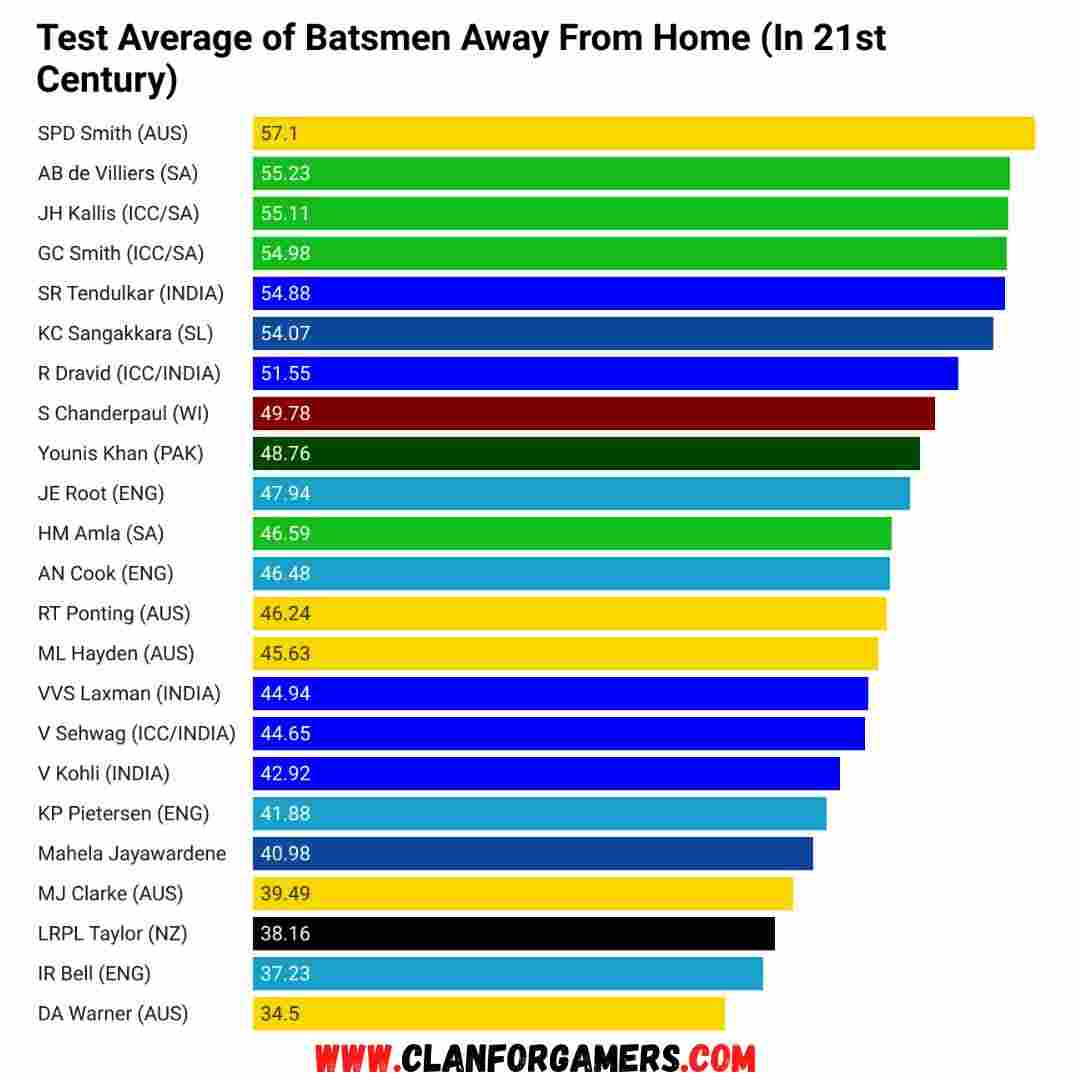
  2. Stats Away From Home
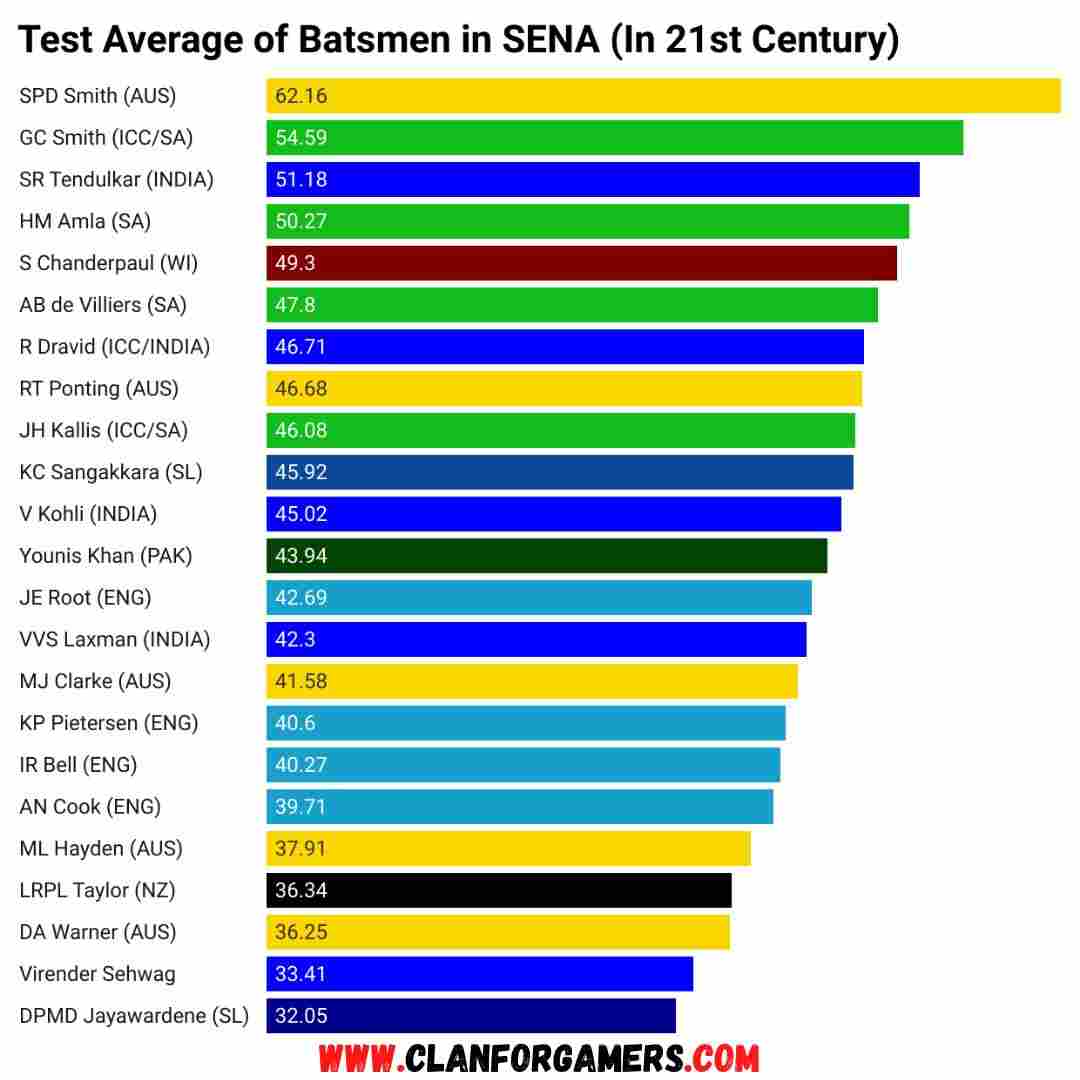
  3. Stats In Sena
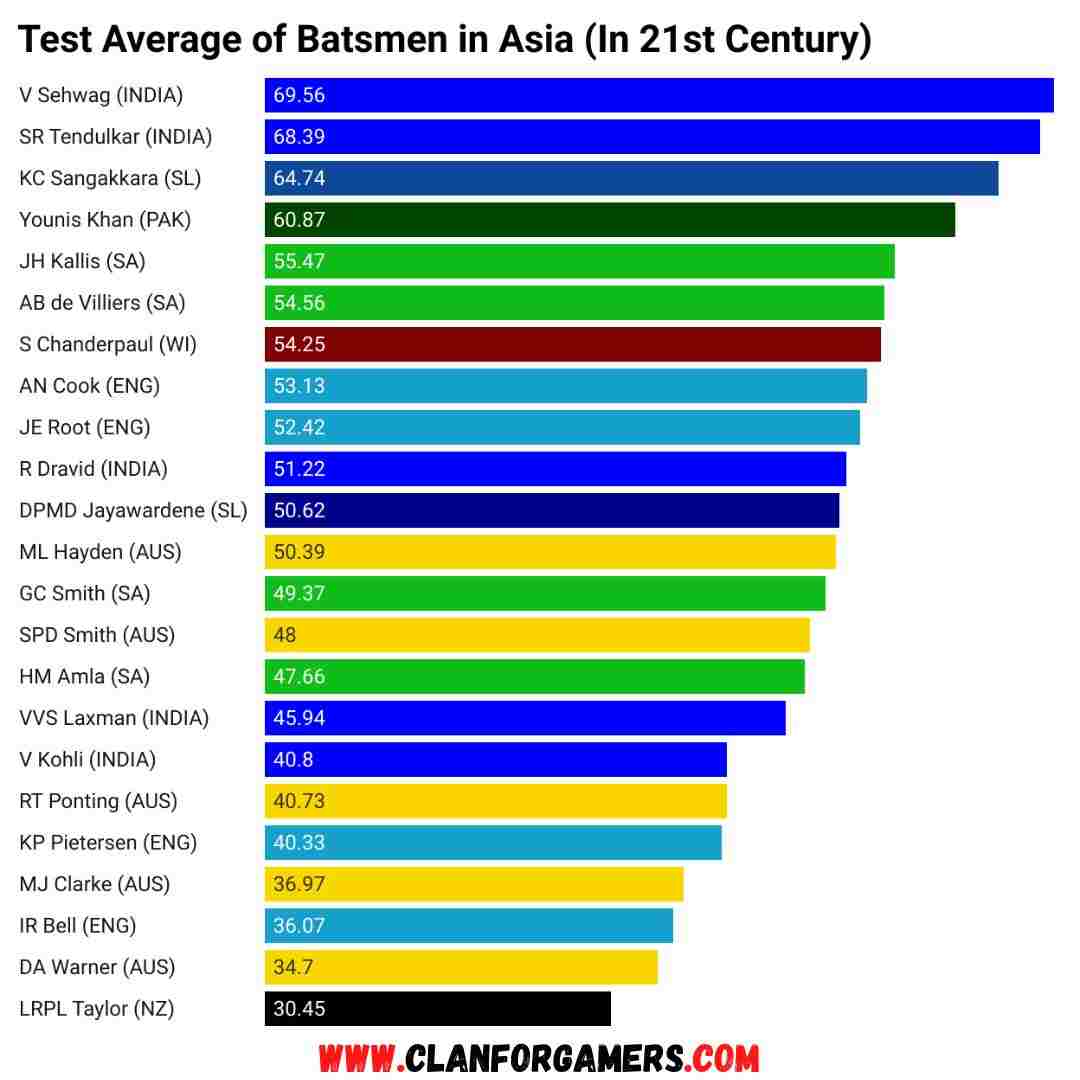
  4. Stats In Asia
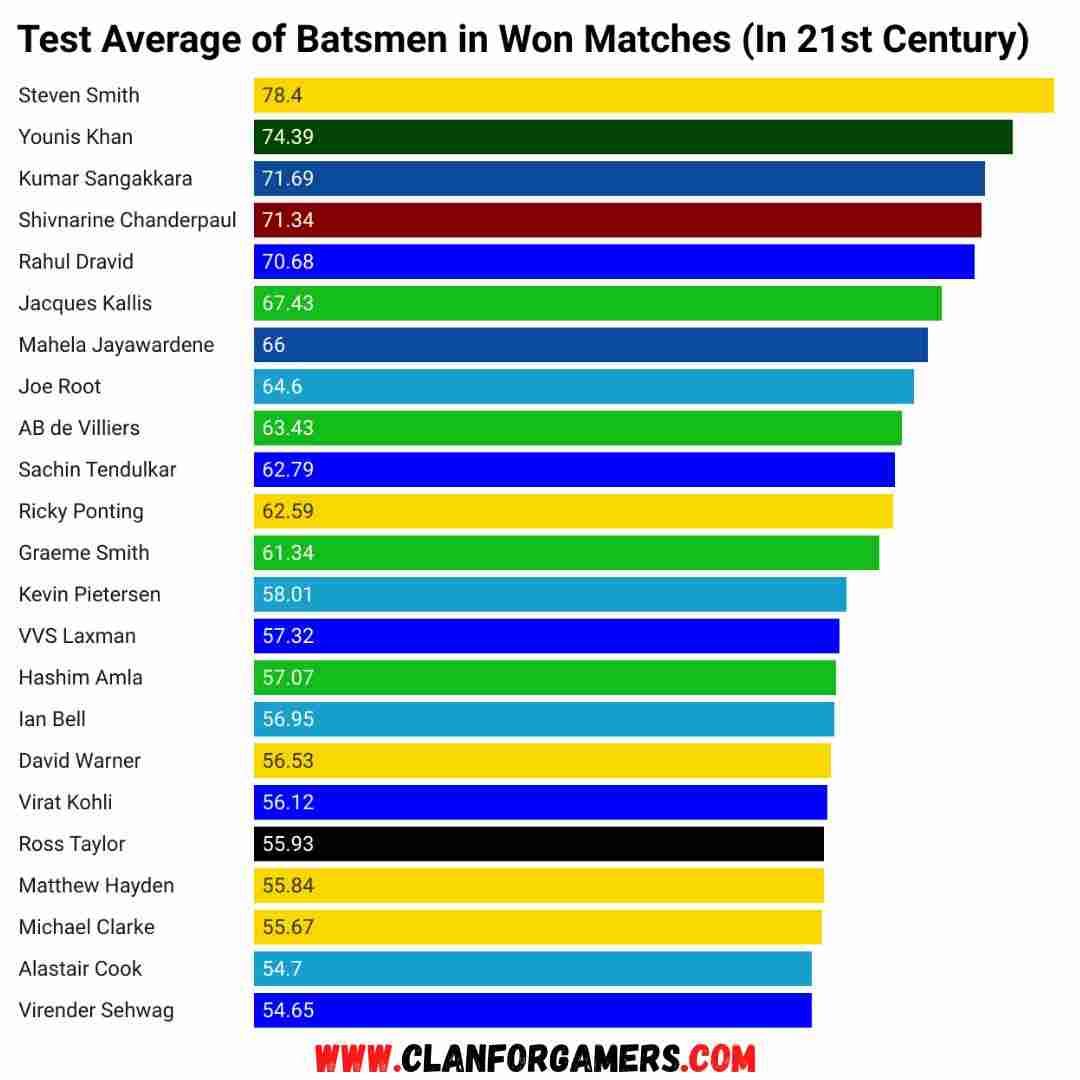
  5. Stats In Won Matches

As we are discussing the top 8 batsmen in detail, you can scroll down to the bottom if you are just interested in the final list.

Abbreviations Used:-

  • M-Matches
  • I-Innings
  • R-Runs
  • Av.-Average
  • S- South Africa
  • A- Australia
  • E- England
  • N- New Zealand

Abraham Benjamin De Villiers

“I have been saying for the past 30 years that Vivian Richards has to be the best batsman of all time. But I am going to have a reassess that because this guy is something extraordinary.” 

Bob Wills, the great English spinner said this for Abraham Benjamin de Villiers.

That was the stature of the guy who is placed at no.8 on our list. 

Known around the world as a white-ball cricket beast, ABD was equally great in the longest format of the game.

He started his Test career as an opening batsman and then managed to become one of the greatest no.5/6 batsmen in the history of the game.

ABD has scored 8765 runs in 114 matches with an average of 50.66, including 22 centuries.

Talking about shots, He can play Pull, all kinds of sweeps, all the shots, whichever exists in this game, still, his lofted straight drive is something else. Along with that, he had a rock-solid defence, too.

“Conditions don’t matter much for a batsman like him” as he averages 40+ in all the countries he played in, except BAN and ZIM where he just played 2 and 1 matches respectively.

He played many great knocks in his Test career such as 278* against PAK (Abu Dhabi),  43*(297 balls) against Ind (Delhi) and a similar type of knock against 33*(220) against AUS (Adelaide), But his knock of 217* at Ahmedabad is a standout performance for me which helped SA to defeat IND by the margin of innings and 90 runs that too in India.

Even while playing as a WK-Batsman. He averages 57 with 7 100s in just 24 matches; Just Unbelievable!!

We totally considered 5 criteria while preparing this list; ABD averages 50+ in 4 out of 5. (5 out of 5, if the innings where he opens are excluded.)

OVERALL STATS:-
M-114    I-191    R-8765     Av-50.66     100-22

STATS AWAY FROM HOME:-
M-44    I-76     R-3396     Av-50.68     100-7

STATS IN ENA:-
M-19    I-32     R-1434     Av-47.80     100-3

STATS IN ASIA (OTHER THAN HOME):-
M-21   I-36      R-1746     Av-54.56     100-3

STATS IN WON MATCHES:-
M-57   I-83     R-4631     Av-63.43      100-16

Graeme Smith

South African Cricket was facing a downfall after the fixing scandal and after the loss of their captain, Hansie Cronje; but then came a 22-year-old man who helped RSA to maintain their existence not only with his captaincy but with his batting brilliance too.

He was none other than  ‘GC SMITH’ and he is the next man on our list. Smith played 117 matches, scoring 9265 at an average of 48.25 with 27 centuries.

Graeme Smith is the player who performed better in away matches as compared to home as he scored 4800+ runs outside the home at an average near 54, which is great for an Opener and his performance was up to mark in Asia too as his average here was near 50 with 4 tons.

His score of 259 in 2003 is the highest ever by a visiting batsman at Lord’s.’ GC Smith and ‘Neil Mackenzie’ also hold the record for the highest 1st wicket partnership of 415 which they made against Bangladesh in 2007.

Graeme Smith with the bat was one of the prominent reasons for RSA dominance as he averaged 61.34 in won matches with 18 of his 27 tons resulting in Victory, whereas 9 resulted in a draw. So, his 100 Never went in vain.

OVERALL STATS:-
M-117    I-205    R-9265      Av-48.25    100-27

STATS AWAY FROM HOME:-
M-52   I-96     R-4854     Av-53.93     100-15

STATS IN ENA:-
M-28   I-54     R-2675    Av-54.49      100-9

STATS IN ASIA:-
M-21  I- 35     R-1728    Av-49.37     100-4

STATS IN WON MATCHES:-
M-60  I-94     R-5214    Av-61.34     100-18

GC Smith is one of the best test openers of all time and the only opener on our ”The Top 8 Test Batsmen Of This Century” list.

Shivnarine Chanderpaul

Shivnarine Chanderpaul standing at the crease provided Brian Lara with security and could attack the bowlers from the other end. 

He is the first Indo-Caribbean to play 100 Tests for the West Indies. His Crab-like batting stance was the highlight of his career and throughout the century; He scored 9633 runs at an average near 55 with 28 100(s).

Apart from being the defensive Batsman, sometimes he has played the attacking role too; his 100 of 69 balls against Australia in 2001 is the 6th fastest test 100 of all time.

On 4 instances, he played 1000 minutes without getting dismissed. No one has ever done this even three times, and only Rahul Dravid has achieved this feat two times.

He scored 558 runs averaging 111.60 in 2007 and 909 averaging 101 in 2008 to become the only batsman after Sir Donald Bradman to score 500+ runs in two consecutive years with a 100+ average.

Out of 127 tests he played, the Windies could manage to win only 27 where Chanderpaul played a vital role while Averaging 71+ in won matches.

OVERALL STATS:-
M-127    I-218    R-9633      Av-54.73    100-28
STATS AWAY FROM HOME:-
M-61   I-107     R-4479     Av-50.89     100-11

STATS IN SENA:-
M-36   I-66     R-2712    Av-49.30      100-7

STATS IN ASIA:-
M-23  I-39      R-1682    Av-54.25     100-4

STATS IN WON MATCHES:-
M-29  I-45     R-2283    Av-71.34     100-9

Rahul Dravid

“Try to take his wicket in the first 15 minutes, if you can’t then only try to get remaining wickets”.

Greatest ever test Captain ‘Steve Waugh‘ saying this depicts the stature and Mental Strength of ‘Rahul Dravid’.

After all, Dravid played most no. of the deliveries in his test career(31258) and none other batsmen even faced 30000. He is also the batsman to spend the most time at the crease in test cricket with 44152 minutes.

He played 130 matches in this century, scoring 10590 with an average of 53 scoring 30 centuries.

Jammy was the first man to score test centuries in each nation he played(the last test century in New Zealand was in 1999).

He was regarded as THE WALL because of his defensive type of play, but the way he played flick shot is one of the best played by a Cricketer over the years.

Rahul played a lot of Wonderful innings outside the home but his knock of 233 at Adelaide Oval in 2003 BGT that helped India win the match is still regarded as the best by many Cricket experts.

Jammy was also involved in one of the greatest test partnerships of all time with VVS Laxman;i.e. of 376 runs in 2001 against Australia at Kolkata, which resulted in Indian Victory after follow-on.

The ICC awards were started in 2004, and he was the inaugural winner of the “Test Player of The Year” award.

Only 3 of his 30 centuries in this century resulted in India’s defeat (15 in won matches and 12 in draws). Also, he averaged a whopping 70.68 in matches India won.

OVERALL STATS:-
M-130    I-228    R-10590      Av-52.95    100-30

STATS AWAY FROM HOME:-
M-76   I-136     R-6135     Av-51.55     100-16

STATS IN SENA:-
M-38   I-74     R-3083    Av-46.71      100-7

STATS IN ASIA (OTHER THAN HOME):-
M-22  I-36      R-1588    Av-51.22     100-6

STATS IN WON MATCHES:-
M-49  I-80     R-4665    Av-70.68     100-15

Kumar Sangakkara

If I had to describe Kumar Sangakkara in one word, it would be insatiable. If we were to rank the best WK Batsman, he should surely be there among the top rankers.

His stats are quite phenomenal with 12400 runs in 134 matches with a quality average of 57.40 for the team of Sri Lanka, an emerging team at that time, and punching well above its weight, and Sanga has a major role in this journey.

He always had the hunger to score runs. He scored 38 100(s) of which at least 11 were double centuries (only second to Sir Donald Bradman). 

Once he got on top, he was absolutely fantastic and his cover drive is a treat for Cricket fans.

He set up the world record for the highest partnership in Test cricket of 624 runs along with his Partner Mahela Jayawardene in July 2006 against South Africa. Individually, he scored 287 runs in this match, which is his second-highest score.

He was ranked the highest test batsman on 7 December 2007 with rating points of 938; till this date, this is the highest ever rating achieved by a Sri Lankan batsman.

He is also the first batsman to score 150+ runs in four consecutive tests.

Out of the 134 matches he played, SL won 54 of them and Sanga scored 19 of his 38 centuries In won matches, at an average reaching near 72.

” Sometimes you come up short against a guy who plays as well as that and you don’t feel quite so bad “

SIR Alastair Cook said this about the Sri Lankan Great

This describes that apart from being a great batsman, he was a gentleman of the game too.

Note:-From 8000-12000 runs, Sangakkara is the fastest man to reach every 1000 run mark(i.e. fastest to 8000,9000,10000,11000,12000)

OVERALL STATS:-
M-134    I-233    R-12400      Av-57.40    100-38

STATS AWAY FROM HOME:-
M-53   I-97     R-4888    Av-53.13     100-14

STATS IN SENA:-
M-30   I-59     R-2526    Av-45.92      100-7

STATS IN ASIA (OTHER THAN HOME):-
M-23  I-41      R-2525    Av-64.74     100-8

STATS IN WON MATCHES:-
M-54  I-84     R-5449    Av-71.69     100-19

Here Begins The Top 3!!

Steven Smith

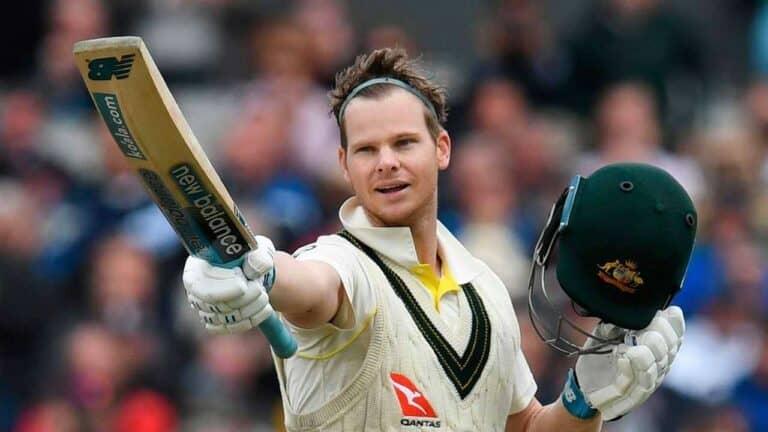
Who is the best Test Batsman of the current generation? Steven Smith
a long gap
and then any other batsman.

Starting his career as a leg-spinner, Steven Smith has emerged as the best Test Batsman of the last decade. 

Playing 77 matches, he scored a total of 7784 runs @59.87 with 27 centuries. Also, his away test average is higher than 60.

 ”Everyone makes mistakes; it’s about the way you respond to it that’s really important.”

Steven Smith

If Comeback is a word, Steven Peter Devereux Smith is the Synonym. After suffering from a one-year ban in 2018-19; Steven Smith announced his comeback in test cricket in style. 

In Ashes 2019, he scored 774 runs in 7 innings at a staggering average of 110.57 with 3 100(s) and 3 50(s).

Many Australian batsmen struggled hardly on Spinning pitches in India, but Smith averages 60 in India with 3 100(s). Smith showed his pure masterclass in the Pune 2017 test, scoring 109 runs on a pure rank Turner against the likes of Spin Wizard Ravichandran Ashwin, Ravindra Jadeja and Jayant Yadav.

Individual innings scores of the Indian Cricket Team were less than Smith’s Second Inning Scores (105 and 107).

Smith is the only present cricketer on this list and his 947 Test Rating points is the second-best by any test batsman(Sir Donald Bradman being at the top with 961 points)

Smudge’s Average hikes up to near 75 in the matches Australia won and his 18/27 100(s) resulted in Kangaroo’s Victory.

He may emerge as a better Batsman in the future, but for now, we have him as our number 3 Batsman due to the small sample size as compared to others. If he had played 90+ matches with the same stats, he might be the No. 1 Batsman on our list.

Smith has the best test average on our list of the ”The Top 8 Test Batsmen Of This Century” list and also has the second-best career average for the Batsman with 2500+ test runs. Only behind ‘Sir Donald Bradman

OVERALL STATS:-

M-82    I-147    R-7784      Av-59.87    100-27

STATS AWAY FROM HOME:-
M-35   I-66     R-3609     Av-60.15     100-13

STATS IN SEN:-
M-22   I-40     R-2300    Av-62.16      100-5

STATS IN ASIA:-
M-13  I-26      R-1200    Av-48.00     100-4

STATS IN WON MATCHES:-
M-43  I-72     R-4584    Av-74.37     100-18

Sachin Tendulkar

”I See Myself When I See Sachin Batting”

This famous statement was given by The Great ‘Sir Donald Bradman‘ to praise the batting of SRT.

To be honoured by this type of statement by a Great like him shows the quality of the player.

In the 13 years he played in this century, he scored 10080 runs in 127 matches with an average of near 52 and 29 Hundred. His away average was also higher than his overall average.

Australia and South Africa were considered the best teams for the long initial part of this century and Sachin dominated them at home averaging >55 and 3 centuries in both countries.

In BGT 2003; Sachin only scored 82 runs in the first 5 innings, with bowlers targeting him outside the off stumps. but in the fourth Sydney test, Sachin had other plans as he scored a Mammoth 241 runs not out without playing a single cover drive, and this Inning was an example of the determination Sachin possesses on the field.

We have considered five factors as Stats for choosing ”Best Test Batsmen of This Century”, and Sachin is the only Batsman to average 50+ in all these criteria.

Many fans still think that his Innings don’t benefit the team but the fact is that 16 of Sachin’s 29 tons were scored in won matches,9 in draws and only 4 of those in lost matches shows quite a different picture. 

Sachin is arguably the best Indian test batsman (Only debatable with Sunil Gavaskar) and also an ideal No. 4 for an all-time Test Team.

OVERALL STATS:-
M-127    I-214    R-10080      Av-52.22    100-29

STATS AWAY FROM HOME:-
M-63   I-109     R-5379     Av-54.88     100-16

STATS IN SENA:-
M-37   I-70     R-3276    Av-51.18      100-8

STATS IN ASIA (OTHER THAN HOME):-
M-19  I-27      R-1573    Av-68.39     100-7

STATS IN WON MATCHES:-
M-54  I-85     R-4584    Av-62.79     100-16

Jacques Kallis

After a 22-year-long apartheid ban from Cricket, the South African test team emerged as a Great cricketing nation in 1990(s) and 2000(s); they were a mighty force to reckon with, and one of the reasons for this was JACQUES HENRY KALLIS.

Solely as a batsman, he is the best test batsman of this century till now. His numbers speak for his ability, as he scored 11440 runs in the 134 matches, he played at an average of 58+. He also scored 40 100(s) which is the highest by any Batsman in this century.

Except for England and Sri Lanka, where he averaged 32 and 35 respectively, JH Kallis dominated the world as he averaged 50+ in each country where he played 4+ matches in this century.

In the 2003/04 season, Kallis achieved a rare feat of scoring centuries in five consecutive matches which were achieved only by Donald Bradman before him. Mohammad Yousuf and Gautam Gambhir are the other two batsmen to do the same after Kallis.

Against Sri Lanka at New Lands in January 2012, he made his highest test score of 224.

In 2005, he was the co-receiver of the ICC Player of the Year award, shared with Andrew Flintoff.

If he isn’t the greatest test cricketer of this century, then there would be a good discussion of why he is not!

OVERALL STATS:-
M-134    I-229    R-11440     Av-58.66    100-40

STATS AWAY FROM HOME:-
M-61  I-111     R-5066     Av-55.06     100-16

STATS IN ENA:-
M-27   I-50     R-2074    Av-46.08      100-5

STATS IN ASIA:-
M-24  I-43      R-1997    Av-55.47     100-8

STATS IN WON MATCHES:-
M-67  I-100     R-5530    Av-67.43     100-20

Jacques Kallis, along with Ricky Ponting was the best batsman of the 2000(s) decade; To know about the best 11 of that decade, read our article: ”The Greatest Test 11 Of The 2000s”.

We have one more Player as our special mention on this special list.

Ricky Ponting

If anyone of you is still there reading our article, you might have been wondering why Ricky Ponting is not part of our ”The Top 8 Test Batsmen Of This Century”. Here’s the catch!!

Punter was clinical in the initial 6 years of the century (averaging 60+ 4 times in 6 years), but in the latter half, he never averaged 50+ in a test batting calendar.
Stats In First 6 Years:-(1 Jan 2000-31 Dec 2006)
M-76   I-130  R-7231   Av-65.73   100-27

Stats In Last 6 Years:-(1 Jan 2007-30 Nov 2012)
M-59   I-105   R-4055  Av-40.14   100-8

For the batting greats to have ever played the game, his decline should be one of the worst, along with ‘Sir Vivian Richards’ who also just averaged 42 in his last 6 years contrary to his overall average of 50.24.

One more reason for his omission from this list was his record in Asia (particularly India). Against the likes of Spin Wizards ‘Anil Kumble’ and ‘Harbhajan Singh’, the Punter couldn’t find a way to score as he averaged less than 30 in India and 40 overall in Asia.

He was the first cricketer to be awarded ”ICC Player Of The Year” in consecutive 2 years(2006-2007). Also, his score of 242 in Adelaide in 2003-04 BGT is the highest ever Innings score in a losing cause.

Ponting also holds the record for scoring the most runs by a test player in Won matches (also in this century). He scored 7950 runs in won matches and also scored 27 of his 35 100(s) in the same.

OVERALL STATS:-
M-135    I-235    R-11286     Av-53.48     100-35

STATS AWAY FROM HOME:-
M-57    I-102     R-4416     Av-45.52     100-13

STATS IN SEN:-
M-31    I-54     R-2381     Av-46.68     100-7

STATS IN ASIA:-
M-20   I-35      R-1385     Av-40.73     100-4

STATS IN WON MATCHES:-
M-88  I-148     R-7950     Av-62.59      100-27

So, we finish our article with this special mention and the final list is:-

  1. Jacques Kallis
  2. Sachin Tendulkar
  3. Steven Smith
  4. Kumara Sangakkara
  5. Rahul Dravid
  6. Shivnarine Chanderpaul
  7. Graeme Smith
  8. Abraham Benjamin De Villiers

Special Mention:-Ricky Ponting

This article was about the ”Best Test Batsman of This Century” and of the 9 players mentioned, one is an opener, 7 of 9 from the golden era of test cricket and just one From the current lot.

Kindly share the article on each of our social media platforms if u liked it.

Thank You, Readers!

Era Adjusted Bowling Average, Economy and Strike Rate in ODI Cricket

Another article in which we will introduce the readers to a new metric that will be very useful and completely fair for comparing bowlers from different eras in ODI cricket. 

ODI cricket has changed pretty much throughout the years, A total of 200 in the early days would have been a match-winning score, but that same score was now a below-average score, even in average cases current Top ODI teams generally cross 200 around the 40 over the mark and then aim of something around 300 to win the match.

The change is huge and cannot be ignored when comparing two bowlers of completely different generations. 

So what to do when we have to compare two bowlers from completely different eras, Joel Garner, with some like Mitchell Starc? Is it fair to compare their numbers as they are; Absolutely. No.

To deal with this, we have a metric in which we will compare the bowler stats with the mean stats of their ERAs to obtain a number (Z-Factor) and then we will use this Z-Factor value to convert the stats of all the bowlers (we are comparing) adjusted towards a particular time period, which will be common for all players.

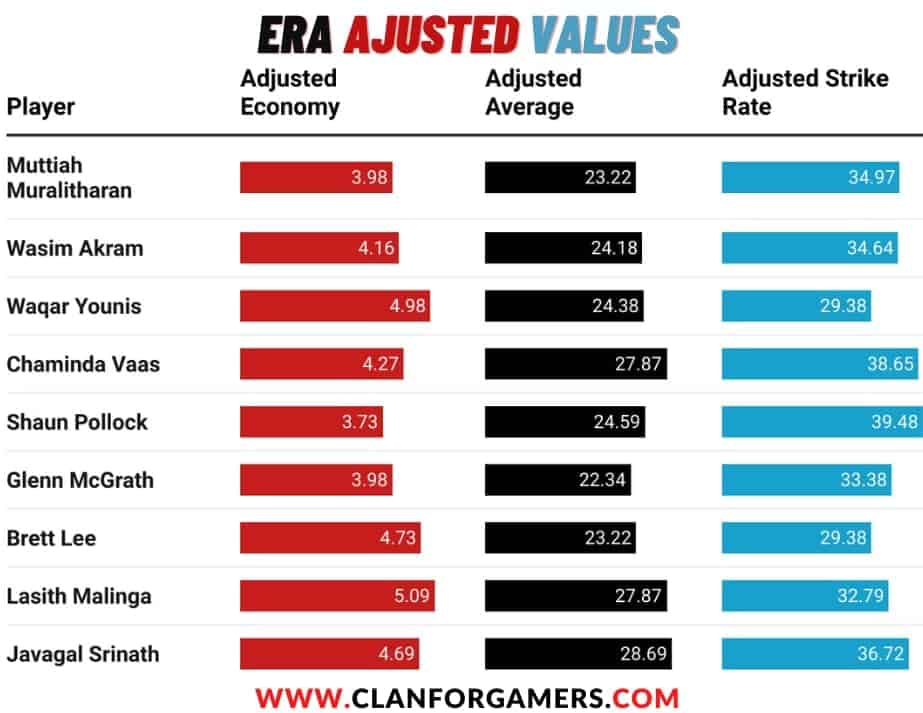
In the end, we will get Era Adjusted Bowling Average, Economy and Strike Rate which will give us an overview of the Top Bowlers considering the conditions of their ERA.

In your junior classes, you should have read the fundamental concept that for comparing two values with different units, we first have to convert them into the same unit. 

This theory is also based on that principle!!

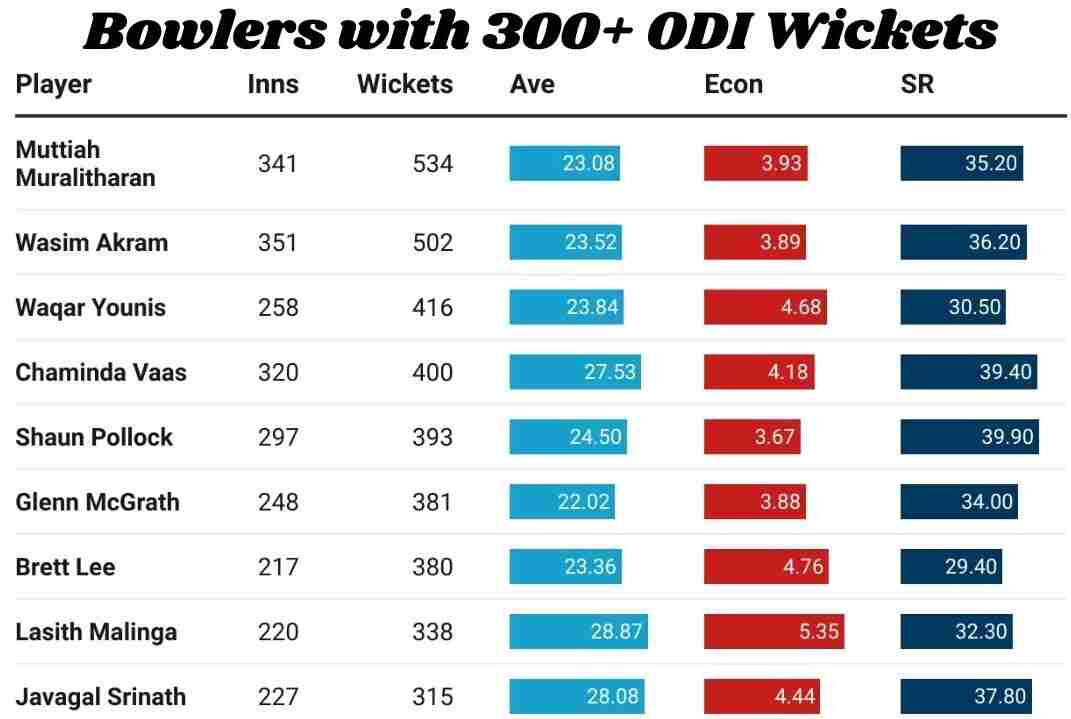
Note: For explaining the metric, I will use the stats of 9 Bowlers, the 9 with at least 300 wickets in ODI cricket.

Z-Factor: What is it? How it is calculated?

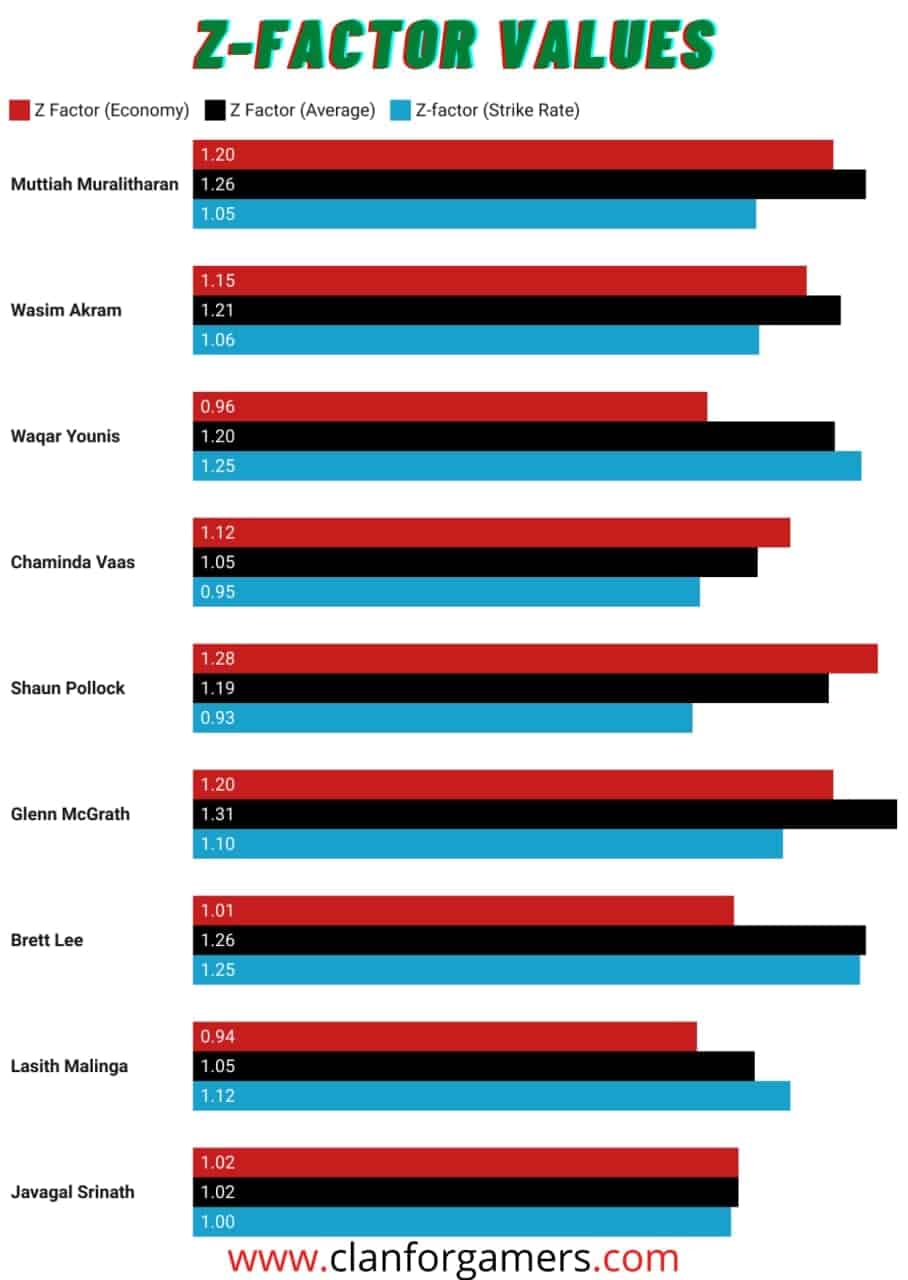
It’s a simple metric that helps us to get our final results. It is a number that shows how great the player was as compared to the mean credentials of his era.

A value of 1 means, the bowler is as good as an average bowler during his days; A value of 1.2 means his stats were 1.2 times better than the mean stats during his playing days. A number less than 1 means that bowler numbers in a particular metric (avg, eco, sr) are even below the average numbers. 

So, the value of the Z-Factor is directly proportional to the player’s dominance in his era. 

Now the question will arise; How to calculate the Z-Factor values?

Just divide the mean runs (conceded by a bowler) per wicket of that bowler playing days by the bowler’s bowling average.

Do the same with Economy(RPO) and strike rate (Balls per wicket).

You will get the Z-Factor value of the player’s Bowling average/strike rate/economy.

In simple words, the Z- Factor of a bowler ( Bowling average) is: Mean Bowling Average during his playing days/ His Bowling Average.

For Example, In the case of Wasim Akram, his economy is 3.89, and the mean economy of bowlers during his playing days is 4.45. Then the Z-Factor associated with the economy rate will be 4.46/3.89= 1.15.

Considering the average in this case, Wasim has a bowling average of 23.52 compared to the mean bowling average of 28.42, during his playing days. Z factor for Wasim Bowling Average will be 28.43/23.52=1.2.

His bowling strike rate is 36.2 and if compared to the mean bowling strike rate of his days, which is 38.27, we will obtain the Z-Factor for Wasim Akram Bowling Strike Rate= 38.28/36.2=1.06.

Z-Factor values for these bowlers are given below:

ERA Adjusted Bowling Average, Economy and Strike Rate

Now, as we have these z-factor values for the selected bowlers, to address the query we discussed in the introductory part, we need to present their stats in such a way that they can be compared with ease.

The way to do this is by using these z-factor values to convert bowlers’ (who played in two different generations) stats into stats from a common era. 

That means stats of Lasith Malinga, who played from 
2004-2019 can be converted in a way that it can be compared to Javagal Srinath, who retired even before the debut of Malinga.

The method to present these stats is quite simple; Just select a random period, 1 January 2000 – 31 December 2010 in our case. Now for all the selected bowlers, we will divide their Z- Factor values from the mean stats for the chosen period.

Mean Bowling Stats during our selected period:  
Balls Per Wicket = 36.72
Runs conceded by bowler per Wicket=29.26
Runs conceded by bowler per Over=4.78

Taking the case of Wasim Akram here again; He has a Z-Factor value of 1.15 for the economy, dividing it from the mean economy of our selected time span (4.78), we get 4.78/1.15=4.16.

That can be treated as Wasim’s Economy Rate if he played in our selected time period (01 Jan 2000 – 31 Dec 2009).

Era Adjusted Bowling Average, Economy and Strike Rate of the selected bowlers are given below:

Conclusion/Summary

A point-based summary of what we have discussed in this article is given below:

  • How ODI cricket has changed throughout the years.
  • Why would comparing the raw stats of two bowlers from different eras be completely unfair?
  • Z-Factor
  • What is Z-Factor?
  • How to calculate it?
  • What does it signify?
  • Era Adjusted Bowling Average, Economy and Strike Rate
  • Why is it a completely fair metric to compare bowlers of two different generations?
  • How is it related to Z-Factor?
  • How is it calculated?

Weighted Batting Average (WBA) in T20I Cricket

Weighted Batting Average, What is it? Why is it used? How to calculate it?? After reading this article, all your questions regarding Weighted Batting Average will be sorted.

In this article, I will try to explain the metric which we will use in our upcoming comparison/analysis-based articles.

Till now, In this world of constant comparisons, You must have been using Average and RPI to compare/judge batsmen in all the formats of the game. Let’s discuss these two metrics first.

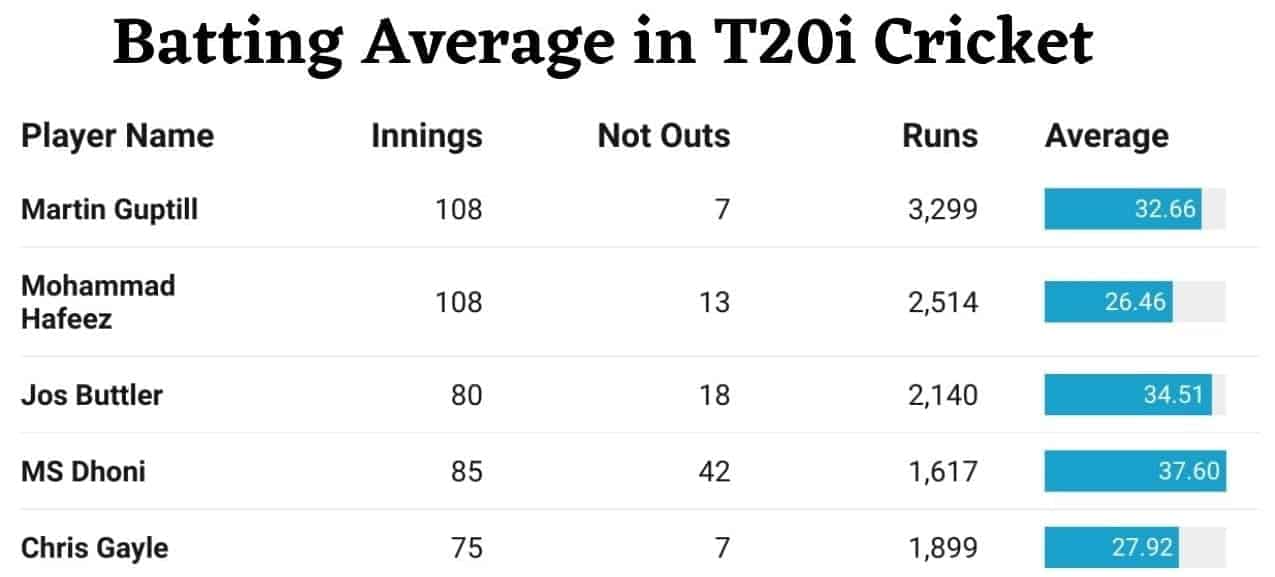
We will analyze 5 different players’ T20i careers with completely different roles in this article to compare all three analytical parameters. All these players have a varied number of not-outs.

These 5 players are Martin Guptill, Chris Gayle, Mohammad Hafeez, Jos Buttler, and MS Dhoni.

Batting Average: Fully Explained

Batting Average= Overall Runs/ (Career innings-Innings in which batsman remained not out)

As you can see, The Batting Average supports Dhoni and Buttler here, the players with higher no. of not-outs as compared to others, especially Gayle and Guptill. Now opening batsmen such as Gayle and Guptill in our comparison, have fewer chances to remain not out if compared to middle-order batsmen. 

As its formulas exclude all the innings (in which the batsman remained not out) during division, it will surely give an advantage to someone like MS Dhoni, as the runs scored by him in that 42, not-out innings (where he remained not out) will be included in overall runs but the innings will be excluded during the division.

That means all the runs he scored in those 42 innings, will remain an extra bonus for him, which is totally unfair.

For example, even innings like Kohli’s 93* against WI will not be included during division, but that 93 runs will not be subtracted; Quite Flawed.!!

This is the major drawback of averages, as they give an unfair advantage to middle-order batsmen and finishers over top-order players. 

Now, to cover this drawback, we have RPI. So let’s see about the RPI by analyzing the same players again.

Everything About Runs Per Innings (RPI)

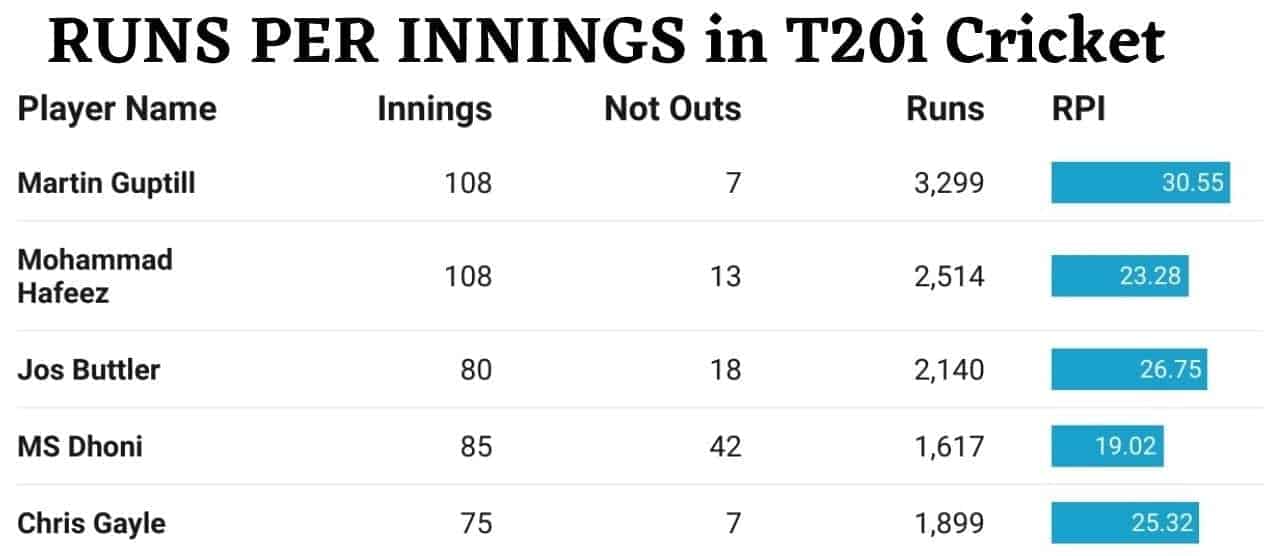
Runs per Innings (RPI)= Overall Runs/Innings Played

As visible in the above photo, RPI gave us a completely different overview; Dhoni who has the highest Batting Average among the 5, has the lowest RPI too. 

RPI as said Runs Per Innings includes all the innings, even when some like Dhoni, who usually bats at no.5/6, came in the 19th over and faced 2 balls and remain not out. 

This metric will use that inning as complete innings; That innings where he gets only 2 balls to play will hold the same weightage as an inning an opener got to play. 

Dhoni has 42, not-outs (Most in T20i cricket), which means almost 50% of innings he remained not out.

Many not-out innings of MS are even below 10 scores. RPI will count them as a complete inning and too, as valuable as a completed inning by Martin Guptill, in which he played 60 balls.

So opposite to Batting Average, RPI is quite unfair for middle-order players, especially for finishers as it gives a superior edge to players who usually bat in the Top-Order and have chances of playing more balls.

The above graph shows the difference between the RPI and the Average of these 5 players in terms of %.

Note: The difference between the RPI and the Batting Average of a batsman is directly proportional to his % of not-out innings.

MS Dhoni and Jos Buttler, as they have higher not-outs, got affected most by using RPI instead of averages. Hafeez, as he has moderate not-outs, was not got affected much and Guptill with the least not-outs, got affected by just 6.5%.

Now, as we discussed RPI is totally against the players with a higher % of not-outs, which means it gives an unfair edge to Top order players while comparing. 

So, both RPI and Batting average have their disadvantages. So what metric to use which is equally balanced for all types of batsmen?

Weighted Batting Average (WBA), solves the issue here. Let’s deeply understand all the stuff about it.

Weighted Batting Average(WBA): A Fair Approach

So, First, discuss What is WBA?, it is a metric that gives an overview of batsmen’s consistency, without giving an edge to any type of player.

It has a mechanism, in which we have to analyze all the not-out innings and then divide them into 2 categories and then use one category to find the WBA.

How to calculate WBA??

It’s quite simple, you just need some basic things about that player’s career such as Innings played by him, Overall Runs Scored, No. of innings in which he remained not out; All the scores at which he remained not out and his career RPI.

The steps are:

  • Include all the innings in which the batsman got dismissed as complete innings (95 in the case of Hafeez)
  • Now, also include all the innings in which players remain not out but scored higher than RPI as a completed inning. (10 in the case of Hafeez)
  • Now add, all the not-out scores below RPI (13+5+1=19, for Hafeez)
  • Divide the resulting sum by RPI. I will call the result “Decay Innings”  further in this article.

WBA= Overall Runs/{Innings in which batsman got dismissed + no. of not out scores above RPI+ Decay Innings)

In which Decay Innings= Sum of all not out scores below RPI/ RPI

Now, For example, consider the case of Mohammad Hafeez; He has played 108 innings in T20i cricket; remained not out 13 times, has scored 2514 runs and has a batting average of 26.46.

His not out scores are, 54*, 13*, 42*, 5*, 25*, 32*, 34*, 53*, 67*, 86*, 99*, 32*, 1*.

The RPI of Hafeez is 2514/108= 23.28.

Not out scores that are below his RPI are 13*, 5*, and 1*. Their sum is 19 and when divided by 23.28 (his RPI), will give us the value of decay innings, 0.8.

So, Mohammad Hafeez’s WBA= 2514/(95+10+0.8) = 23.76.

Let’s Consider another example of MS Dhoni, who played a total of 85 innings in which he scored 1617 runs with a batting average of 37.6. 42 times, MS has remained not-out in his T20i career and his not-out scores are:

9*, 10*, 15*, 16*, 10*, 16*, 18*, 0*, 4*, 11*, 9*, 8*, 7*, 7*, 13*, 13*, 15*, 1*, 7*, 0*, 16*, 19*, 28*, 30*, 23*, 48*, 21*, 22*, 23*, 24*, 24*, 22*, 27*, 20*, 20*, 36*, 39*, 52*, 30*, 20*, 29* 

Dhoni’s career RPI is 1617/85=19.02

There are a total of 22 innings where he remained not out below his RPI (Bold ones); The sum of all the scores in these 22 innings is 214.

Dividing it with his RPI, we got 11.25=Decay Innings of Dhoni’s career.

Now, MS Dhoni’s WBA = 1617/(43+20+11.25) = 21.77

Nothing can be fairer than the WBA; All innings where the batsman got out are included in the three metrics, but the special thing about the WBA is it includes not-out scores correctly.

The not-out scores above RPI are included because a player has already scored the avg. no. of runs he used to score during his career.

That means it cleared the flaw in the Batting Average, which used to exclude the no. of all not-out innings during calculation.

Now, not out scores below RPI should not be included as complete innings, as sometimes Innings like Kohli vs Scotland where he got to play only 2 balls, are also got included as complete innings. 

Agreed that it’s rare for someone like Virat Kohli, who is a top-order player, to have such innings.

But batsmen who generally play at 5/6 can have many innings like that in their career where they got just a moment to bat. (Dhoni having 22 not-out innings below his career RPI, is the biggest example here) 

So for these types of innings, a proportion of innings will be included only, just like in the case of Dhoni; We only counted those 22 innings below his RPI as 11.25 innings (Decay Innings) during calculation. 

That means the WBA cleared the flaw in RPI, in which all innings are included equally despite whether a player got to play 1 ball or 60 balls. 

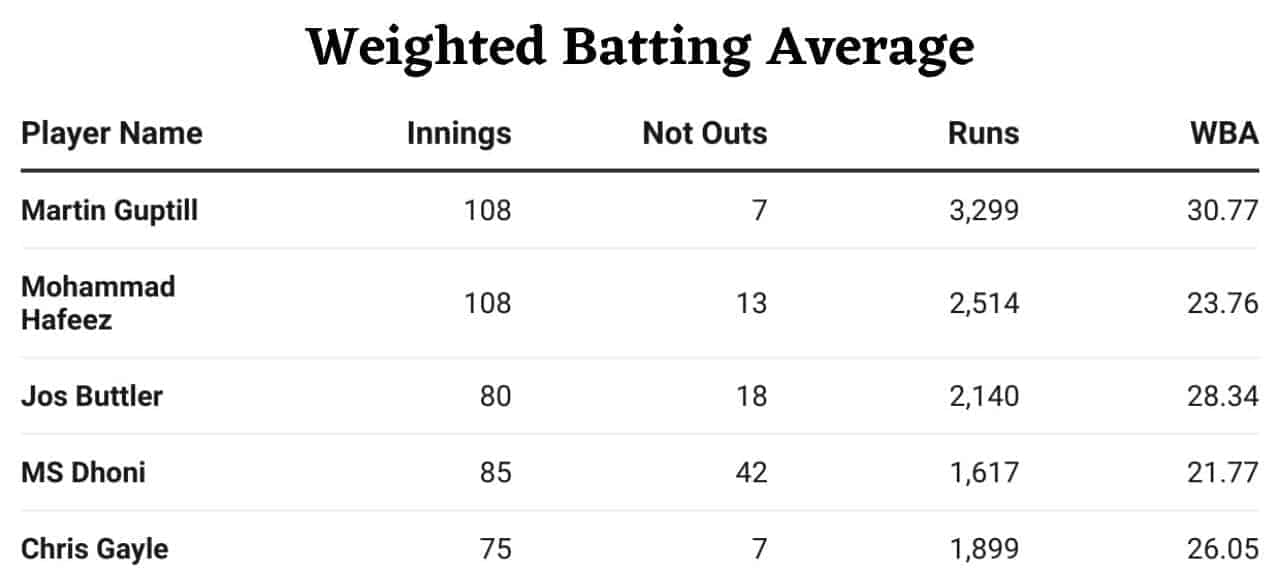
The WBA of the 5 players we discussed in this article is shown in the Table Below:

Note: As we are using some not-out innings as completed, WBA will always remain lower than batting average or equal to it, and as we include some not-out innings in proportion and not as complete, WBA will always remain either higher than RPI or equal to RPI.

In simple language, RPI<=WBA<=Batting average will always remain true.

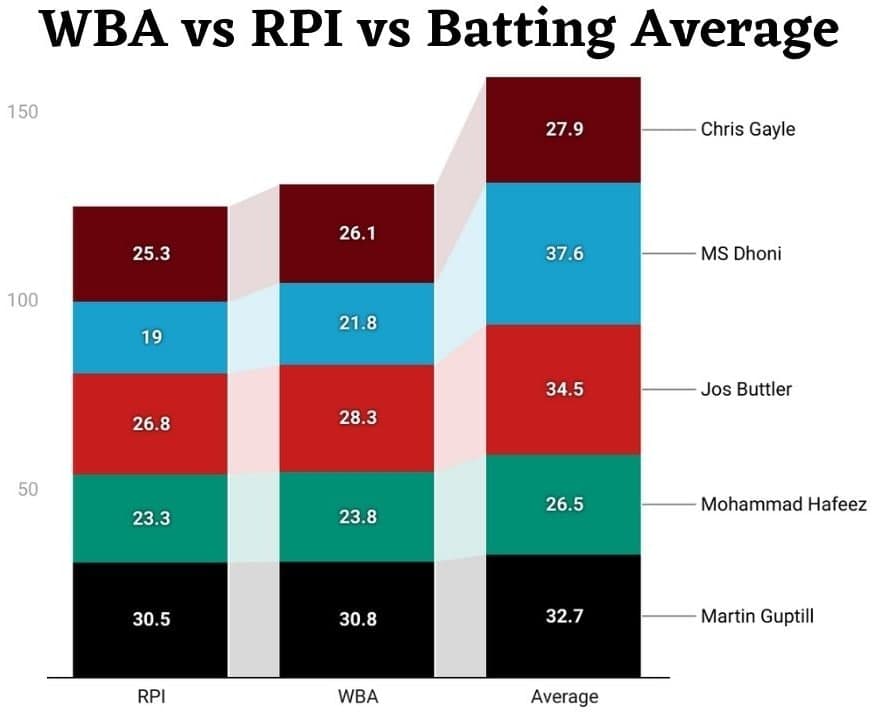
RPI vs WBA vs Batting Average Comparision

The formula for WBA includes most innings almost more than 95% (average case) while division, RPI includes 100% innings and in the case of Batting Average, it generally includes 80-90% innings.

This means the value of the WBA will be closer to the RPI values as compared to the Batting Average value.

The Batting Average, RPI and WBA of these 5 players are also proving our discussed argument valid.

Conclusion

In the beginning, we discussed the 2 basic and mostly used metrics for judging consistency first, and then their drawbacks.

Then introduced you to an advanced and more powerful metric of comparison; Weighted Batting Average.

Discussed everything about it; Hope all your queries regarding WBA are solved after reading this article.

From now on, We will use WBA in all our upcoming articles, especially articles related to T20I cricket.

If you still have a doubt remaining in your mind about WBA, you can ask us in the 24/7 open comments section.

Thanks for Reading!!

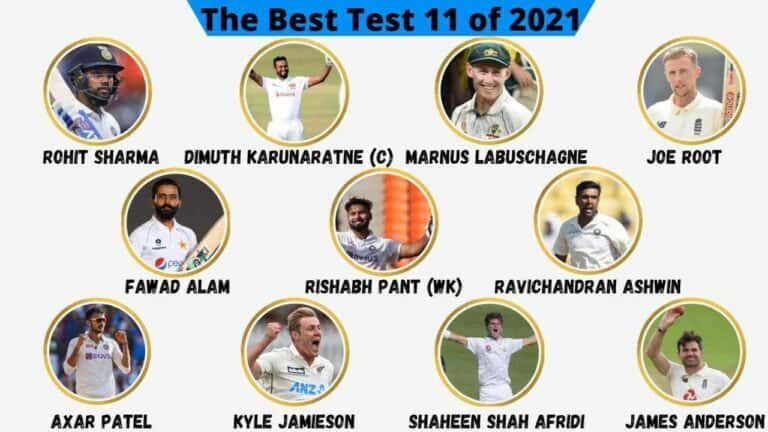
The Best Test XI of 2021

The year 2021, one of the best years in the history of test cricket, is over. There were some remarkable debuts, a few players who showed that they also belonged to the longest version of the game, and some who showed they are still among the best in this game.

The year in which we witnessed some great Test matches such as:

  • Sydney Test Draw by India
  • India Breaching Gabba
  • Kyle Mayers Classic in Chattogram
  • NZ win over India in WTC Finals
  • Lords Test of Ind tour of ENG
  • One wicket win of WI vs Pak
  • Kanpur Test
  • The Ashes
  • India Winning at Centurion For The First Time

There were 44 Test matches in total, many of which were thrillers. Some matches even created history and showed why Test cricket is the ultimate format of this game.

Now it’s time to decide the best possible playing XI based on the performance of players in these 44 tests.

Rohit Sharma

The “Hitman” Sharma showed his worth in test cricket in 2021 and replied to his critics in a significant way that deserves great applause.

Though he was always known as a limited-overs great, Rohit showed his class in the longest format of the game since the day he opened the test innings for the Indian Team.

Rohit Sharma proved to be the best test opening batsman in the world and even the best Indian test batsman during this period.

He started this year with scores of 26 and 52 in the Sydney Test and scored a match-winning 161* against England in Chennai on a highly turning track.

He was the highest scorer in the ENG series that was held in India.

On the IND tour of ENG this year, Rohit Sharma gave the team a good start by scoring three consecutive 30s in the first two matches. 

Then he scored 83 at Lords and a 50 in Headingly. As if that was not enough, he scored his first overseas Test hundred in the last test innings he played this year (127 at the oval).

Rohit played 21 innings this year, scoring 906 runs with an average of 47.68 and 2 hundred.

Dimuth Karunaratne (C)

The Sri Lankan Cap and their most experienced Test batsman have stepped in for his team this year.

Unlike our first opener, he was a well-reputed test batsman even before this year, and he started the year in the same way. 

He played an inning of 103 in the second innings of the Wanderers test match and a 75 in the second match in the Sl tour of WI. However, this is just the tip of the iceberg.

He scored five consecutive 50+ scores (244,118,66,147,83) against Ban and WI at home before getting out to Roston Chase in the second test of the WI tour of SL. 

Karunaratne has played just 13 innings this year but has still managed to score 902 runs with an average of 69.38 and scored 4 centuries, including a double century (244).

Marnus Labuschagne

2019 Ashes, Lord’s Test. Smith got injured by a bouncer, and Marnus became the first-ever concussion substitute in the history of cricket.

He scored 59 runs in the only innings he played in that match, which helped his team win the test match.

Since that day, He never looked back in test cricket.

This year, he played just 9 innings, all at home. Still, he exceeded his competitors to be in this XI.

Labuschagne scored 526 runs in the 9 innings he played this year, including an inning in which he played 0 balls (second inning in Brisbane Test, Ashes 2021). 

In the other 8 innings, he just scored 1 single score of less than fifty (Melbourne Test, Ashes 2021). His scores are 91,73,108,25,74,103,51,1. Consistency at its peak level!!

Joe Root

The best batsman or even the best player in Test cricket in 2021 is an automatic pick in any test team of this year.

After three consecutive not-so-good years by his standards and all the talk of removing him from FAB 4, Root has fully dented his critics with his performances this year.

Started his year with an innings of 228 runs in the first match of the Eng tour of SL, then an inning of 186 in the next game. Totally scored 426 runs in that series, exactly twice the runs of the second-highest scorer (Angello Matthews 213).

In the first match of the Eng tour of Ind, He scored his second double-century of this year (218).

If that was not enough to cover up his previous year’s performances, Root then scored 3 100s in the Ind tour of Eng (109,180*,121). 

In the ongoing Ashes in Australia, he scored 2 50+ in 4 innings (89,62).

He scored 1708 runs in 2021 (the fourth highest in a single year in the history of test cricket) in 29 innings, with an average of 62.69. 

Note: Root has made 6 centuries this year, equal to the number of centuries he scored in 2017, 2018, 2019, and 2020 combined!!

Fawad Alam

After scoring almost 13,000 runs with an average of 56 in First-Class Cricket, he returned to international cricket in 2020.

Alam is a perfect no. 5 batsman for a Test Team due to the reason that he is almost equally great against spin and fast bowling. 

In 2021, he scored three Test hundreds: 140 in Karachi against SA, 109 at Harare against Zim, and 124 at Sabrina Park against the West Indies. 

Along with that, he has 2 50s, a 56 against WI (Sabrina Park), and a 50* against BAN (Shere Bangla National Stadium). 

He can adapt to almost all conditions, and the best thing about him is that he knows how to build test innings.

Fawad Alam knows the art of playing long innings, which can be very helpful after a top-order collapse!!

He has scored 571 runs in 13 innings with an average of 57.10 in 2021.

Rishabh Pant (WK)

The hero of the most significant moment of Test cricket in 2021 (India’s Gabba Victory) is an automatic pick in our Test XI of 2021.

He performed way better than any wicket-keeper batsman in Test cricket this year.

Pant played an innings of 36 and 97 in the Sydney Test match and then an inning of 89* in the Gabba Test, which will be remembered for many years.

Then, In the Eng tour of Ind, Pant scored 3 50+ scores, including an inning of 101 at Narendra Modi Stadium in the 4th Test match.

Along with his batting, his wicket-keeping skills have improved significantly this year, too.

748 runs in 21 innings with an average of 41.53 are great statistics, but they do not show what he has done for this team this year.

Ravichandran Ashwin

This generation’s greatest spinner will be our Test XI’s lead spinner.

Started this year with bowling figures of 2/169 in the Sydney Test 

After that, In the ENG tour of IND, He at least took 3 wickets in each of the 8 innings, including 3 5w hauls.

Then, 4 wickets in the WTC final (2/28 and 2/17) on a pitch with almost no assist for spinners (at Rose Bowl, Southampton).

Also, In the NZ tour of IND, Ashwin grabbed 14 wickets in just 2 test matches

He has picked 52 test wickets (highest) in 2021 with an average of 16.23.

Mind-Blowing Numbers!   

Now, He also offers some batting to our team.

In batting, he has scored 337 runs in 13 innings with an average of 28.08.

Including a century on 3rd day on a turning track and a resilient knock of 39* in the Sydney Test.

Kyle Jamieson

He debuted in 2020 against Ind and showed his class straight away in his first Test series, where he grabbed 9 wickets in just 2 Tests.

Then, he bragged his first 10w haul in his first test match of 2021 against PAK (Hagley Oval, Christchurch).

To follow this, Kyle Jamieson takes a 3w haul against ENG (Lord’s).

Then, he delivered the most iconic spell in his career in the WTC Finals (Rose Bowl, Southampton), taking seven wickets, including the wicket of India’s captain Virat Kohli in both innings.

In the recently finished NZ tour of IND, he took 6 wickets in the first match, which killed the speculations that he would be a flop in Asian Conditions.

27 wickets in 5 Test matches with a bowling average of 17.52, including 3 5w hauls, should be enough to justify why he is in the team.

Jamieson also offers some batting depth to our team, as his Test batting average is also 17 in 2021.

Axar Patel

His class and skill set are not as great as Ashwin’s, though the Power of his sheer numbers will make him a must-have pick in our test xi of 2021.

Makes his debut for the Indian Test Team in the ENG tour of IND and showed his talent by taking 7 wickets in the first match, including the wicket of Joe Root in both innings.

In the 6 innings he bowled in that series, he got a 5w haul in 4 innings, a 4w and 3w haul in the rest 2 innings. 

Axar also continued his dominance in Home conditions in the recently finished NZ tour of IND by grabbing 9 wickets in just 2 matches.

Along with 36 Test wickets in just 5 matches with a bowling average of 11.86 in 2021 (5 5w hauls and a 10w haul)

Axar Patel also has a batting average of 29.83, making him a perfect player to bat at 8 in the team.

Note: The inclusion of Axar Patel means we have to go with an attack of 3 fast bowlers + 2 spinners, along with some part-time spin of Joe Root.

James Anderson

Aging like a fine wine, Anderson, even at 39, has performed enough to be the second new ball bowler of our test 11.

He took a 6w haul in his first match of this year against SL (Galle) on a wicket that was unhelpful for fast bowlers (23 wickets out of 33 were taken by spinners).

After an ordinary two-match series against NZ at home (3 wickets in 2 matches), In the ENG tour of IND, Anderson picked up 8 wickets in 3 matches with a bowling average of 15.88, which is pretty good according to the support that pitches have for fast-bowlers.

Also, in the first test of that series, he picked up 5 wickets, including a match-winning spell of reverse-swing bowling (3/17) in the second innings on a flat track.

Even in the IND tour of ENG, he has performed too well by taking 15 wickets in 4 matches (Avg-24.67).

In the ongoing ashes, he is also the best bowler on his side (Till Melbourne Test), grabbing 7 wickets in just 2 matches with an average of less than 15.

39 Wickets in 21 innings with a bowling average of 21.74, including 2 5w hauls is the overall performance of James Anderson in 2021

Shaheen Shah Afridi

At the age of 21, he is already regarded as a world-class bowler in all formats of the game. 

Although he has just an international career of 4 years, 2021 was his standout year.

He has taken more Test wickets in 2021 as compared to what he got in 2018,19 and 20 combined!!

He performed up to the mark in all the series he played this year. Shaheen picked up 7 wickets in 2 matches in the SA tour of PAK, which helped his team win a Test series against South Africa after 17 years.

Then, he picked up 10 wickets against ZIM (in ZIM) in 2 matches and 18 wickets against WI (in WI ) in 2 matches, including his first 10w haul in the 2nd Test match.

To end 2021 on a high note, He bragged 10 wickets against Ban (In Ban) in 2 matches.

Shaheen will be the first change bowler of our XI.

Overall, he took 47 wickets in 9 matches in 2021 (the highest among Fast Bowlers) with an average of 17.06, including 3 5w hauls and a 10w haul.

Sachin Tendulkar or Rahul Dravid: Better Batsman in Test Cricket?

Let’s start this with a question? Who is The Greatest Test Batsman India has ever produced?

The answer may vary, but legit followers of the game cant reply other than the following three:

  • Sunil Gavaskar
  • Sachin Tendulkar
  • Rahul Dravid

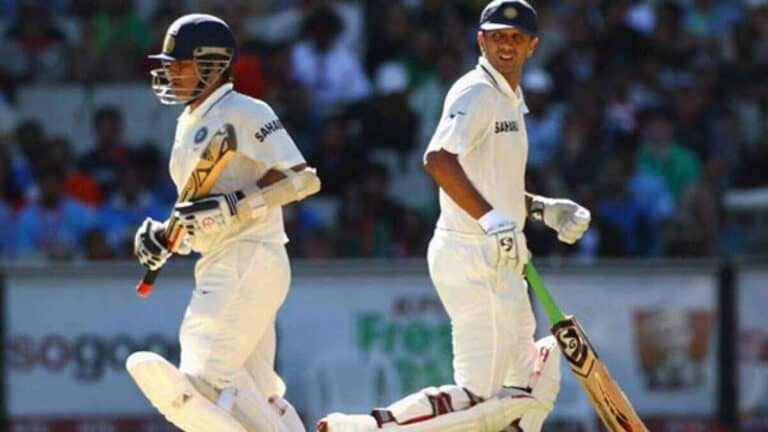
Gavaskar played in a different era, and maybe that’s the talk of another day, but today, we will concentrate on our main topic, which is to find the answer to a widespread debate: who among Dravid and Sachin is a superior test batsman?

Tendulkar played this format for 24 years, While Dravid played for 16 years.

Sachin relied on a varied range of shots. He could drive the ball straight, hook you for a six, and his cut shot was a treat to the eyes.

Rahul Dravid was regarded as “The Wall” and famously known for his defence, but his flick shot was considered the best played by a cricketer.

Both combined scored 29,209 Test runs and 87 Test centuries (The highest for a batting pair). 

Dravid was not as good as Tendulkar in ODIs (to be honest, no one in that era was), but the debate about who is better in test cricket is never-ending.

Both almost played in the same era and faced much more similar bowling attacks and conditions, making comparing them simple and completely valid. 

We will discuss various topics/questions in this article, such as who was:

  • Better in Home Conditions?   
  • Better Away From Home?   
  • More Consistent?
  • Better in Tougher Conditions?  
  • More Versatile?  
  • Better in Won Matches?

Who Performed Better in Home Conditions?

Rahul Dravid has scored 5,598 runs in 120 innings with an average of 51.35 (RPI=46.65) while playing in India (Home conditions)

On the other hand, Sachin Tendulkar has scored 7,216 runs in 153 innings with an average of 52.67 (RPI=47.16) in India.

Dravid managed to hit 15 centuries in that 120 innings, which means he takes an average of 8 innings to hit a century in Home conditions.

Tendulkar scored 22 centuries in 153 innings and took an average of 6.95 innings to score a century under the same conditions.

So, in home conditions, Sachin has a slightly better average, higher RPI and takes fewer innings to score a century compared to Rahul Dravid.

Who Performed Better Away from Home?

In the 166 innings played by Dravid (away from home), he managed to score 7690 runs with an average of 53.03 (RPI=46.32)

Under the same criteria, Tendulkar has scored 8705 runs in 176 innings with an average of  54.74 (RPI=49.46)

Dravid has 21 centuries away from home in that 166 innings, which means a century in 7.9 innings.

Sachin also leads here, having scored 29 centuries in 176 innings, a century every 6.06 innings.

So, again, in the end, Sachin has a better average and higher RPI and also takes way fewer innings to score centuries away from home than Dravid.

Who Is More Versatile?

Against Swing

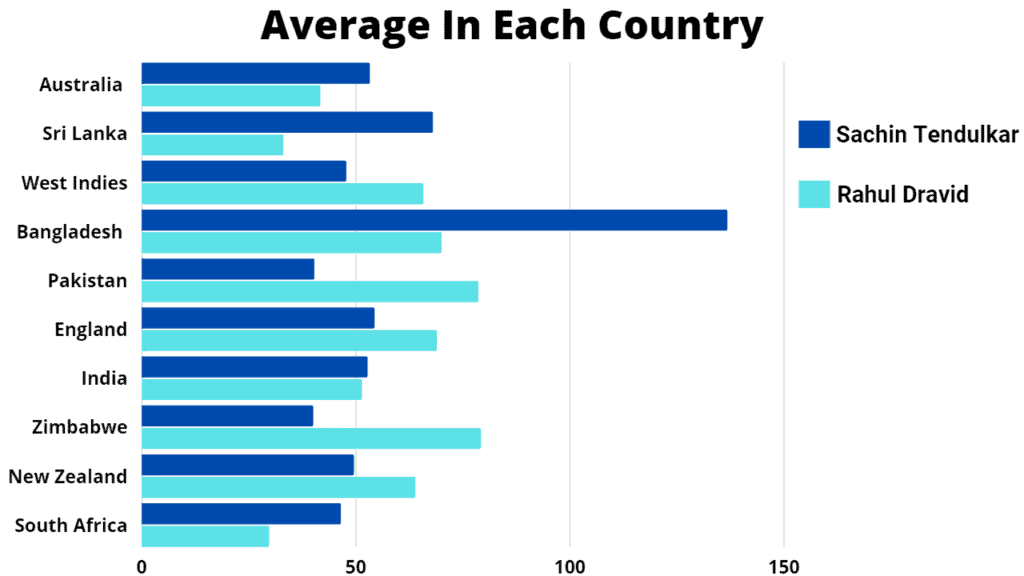
This chart indicates that Dravid seems to be more comfortable than Tendulkar in countering swing. His average is higher in both New Zealand (63.83) and England (68.8) compared to Tendulkar’s average of 49.53 and 54.31 in these countries, respectively.

Against Pace and Bounce

Sachin is significantly better than Dravid in handling pace and bounce. He averages way better in both South Africa (46.44) and Australia (53.21) than Dravid, who averages 29.71 and 41.64 in both countries, respectively.

Against Spin

In the art of playing spin, Tendulkar also holds an upper edge as he is regarded as one of the best players of spin bowling in the last 30 years, and his statistics also justify this tag.

In Asian conditions (excluding home), Sachin has scored 2458 runs in 41 innings with an average of 70.22, while Dravid has scored 1772 runs in 40 innings with an average of 50.62.

Also, in the home of the best spin bowling attack of that time (Sri Lanka), Dravid scored just 662 runs in 21 innings with an average of 33.10, Whereas Tendulkar scored 1155 runs in just 19 innings with an average of 67.94.

Also, Dravid has below-average stats in some countries (South Africa and Sri Lanka).

On the other hand, Sachin’s average didn’t fall below 40, even in a single country.

Who Is More Consistent?

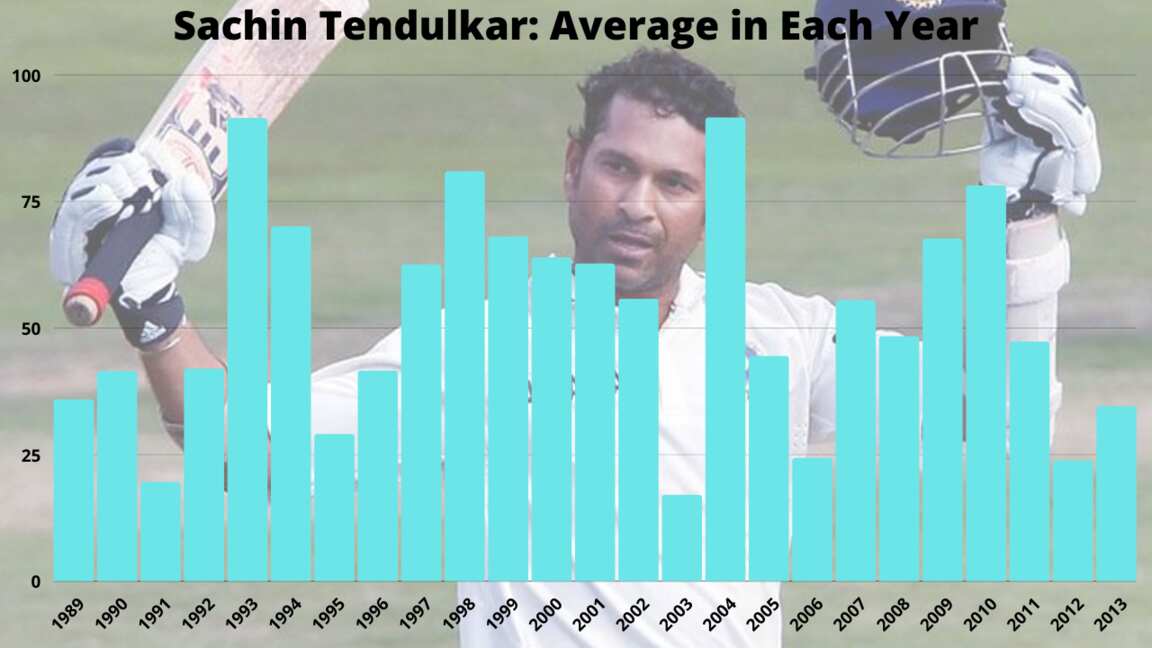
Note: While comparing consistency, we exclude the years in which the batsman has played less than 5 innings. So, in our case, we will not count Sachin’s 1991 and 1995 stats in this section.

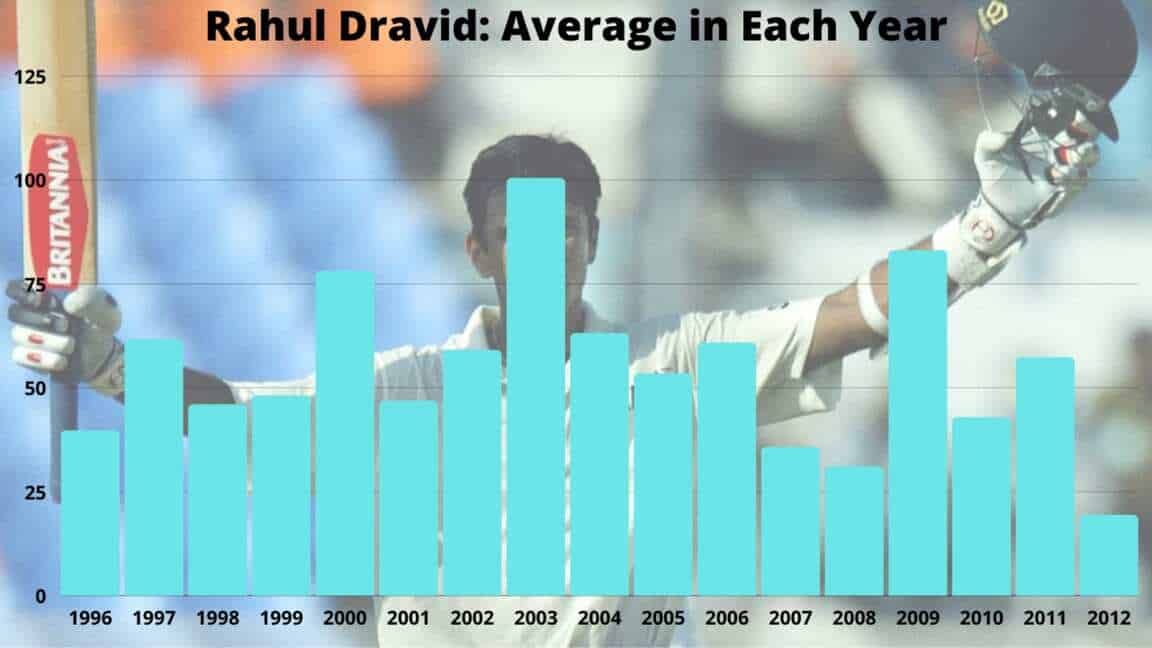
In the 23 years of his Test career (excluding 1991 and 1995), Sachin averaged less than his overall average in 10 years, which is 43.47% of his career years.

Dravid, on the other hand, averaged below his overall average in 9 years of his 17-year Test career, which is 52% of his career years. 

If we take 40 as a standard average, Tendulkar averages less than 40 in 5 years of his career, or 21.73% of career years.

Dravid failed to maintain the average of 40 in 4 years, for 23% of his career years.

Rahul takes an average of 2.88 innings to score a 50 (99 50+ scores in 286 innings).

Whereas Sachin takes 2.76 innings to score a 50 (119 50+ scores in 329 innings)

Who Performed Better in Tougher Conditions?

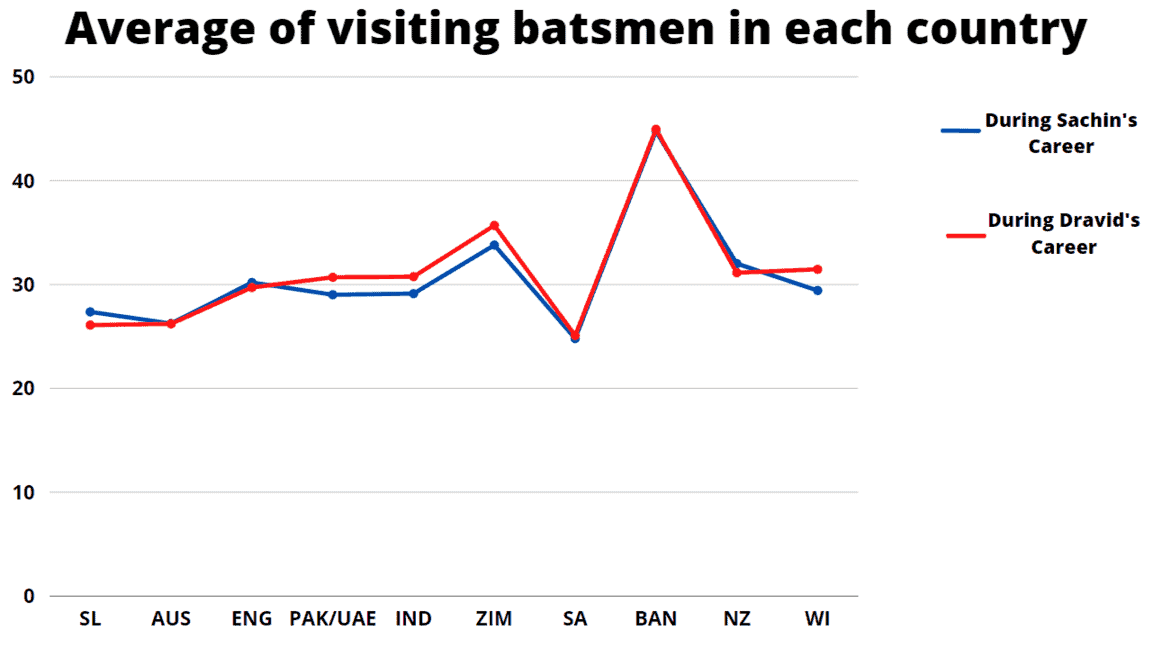
Average of Visiting Batsmen in Each Country (in Test Cricket)

According to the graph of the mean average of visiting batsmen in each country (given above), Sri Lanka, Australia, and South Africa are the toughest countries for visiting batsmen during both playing days. 

Now, if you see Rahul Dravid’s Performances by country (Discussed in the versatility part), you will notice that Dravid is a beast in almost all countries except Sri Lanka, Australia, and South Africa, where he averages 33.10, 41.64, and 29.71, respectively. Quite a coincidence!!

In the case of Sachin, He averages 67.94 (SL), 53.21 (AUS), and 46.44 (SA) in the same criteria.            

To understand how big the difference is, Sachin Tendulkar has played 85 innings in these three countries where he managed to score 4125 runs in 85 innings with an average of 54.27 (RPI=48.52)

In the same criteria, Rahul Dravid scored 2452 runs in 75 innings with an average of 35.53 (RPI=32.69).

Dravid has 3 centuries in that 75 innings, which means a century in every 25 innings; however, Sachin scores a century in almost every 5.3 innings (16 centuries in 85 innings).

An average difference of almost 20 and an RPI difference of almost 16 clearly indicate that the difference here is massive. The rest of the work is done by innings taken per century.

Who Performed Better in Matches Won by India?

Although this criterion has too many flaws, an individual batting performance is not usually enough to win a match for his team, especially in the longest format of the game.

For example, a player can perform in much more challenging conditions where his team’s chances of winning the match are too low, while the other player can score better than him in more manageable conditions. In the end, some people will call the second one better because his runs came in winning cause.

This criterion can never tell the whole story, so it should not be given much importance when comparing two batsmen (in an ideal world, we should not consider numbers like these)

Still, we will compare both players’ stats in won matches to get a complete overview of this topic.

Overall, Sachin has played 113 innings in won matches where he scored 5946 runs with 20 centuries (Avg=61.93, RPI=52.61, Inn/100=5.65)

In 92 innings, Dravid scored 5131 runs with 15 centuries in the same filter (Avg=65.78, RPI=55.71, Inn/100=6.13).

Under the same filter, away from home, Sachin has scored 2017 runs in 31 innings with 9 centuries (Avg=80.68, RPI=65.06, Inn/100=3.44),

Dravid scored 2293 runs in 38 innings with 7 centuries (Avg=69.48, RPI=60.34, Inn/100=5.42)

Sachin is slightly better here, too, but as I said in the beginning, this criteria has too many flaws.

Seeing Sachin better in this criteria will be shocking for some fans who always used to listen/read that Dravid was better or more crucial (or some other buzzwords they use on social media) in won matches.

That was the last criterion to compare, and as you can see, Sachin is better at every criterion we have discussed in this article. That takes us to the conclusion that:
Sachin Tendulkar is better than Rahul Dravid in Test cricket. However, Both players were equally important to the Indian Team.

Without a doubt, they are both among the best Test Batsmen in the history of the game. 

Thanks!!

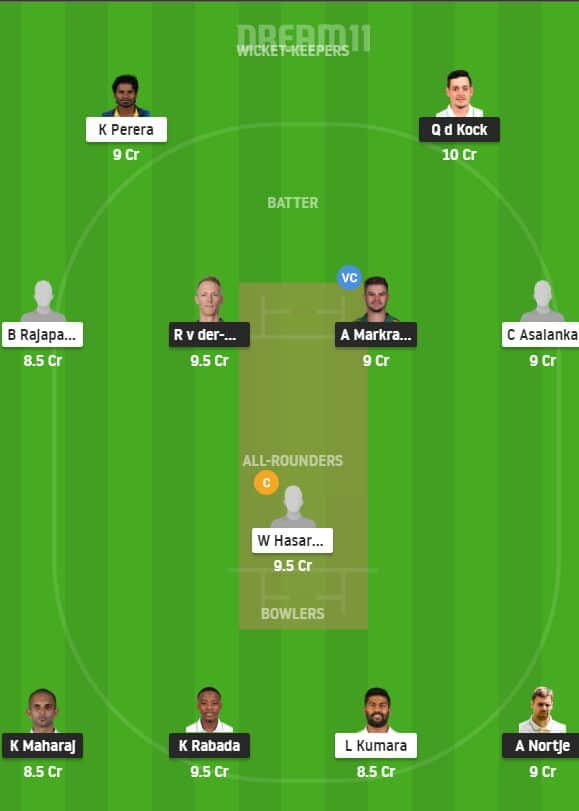
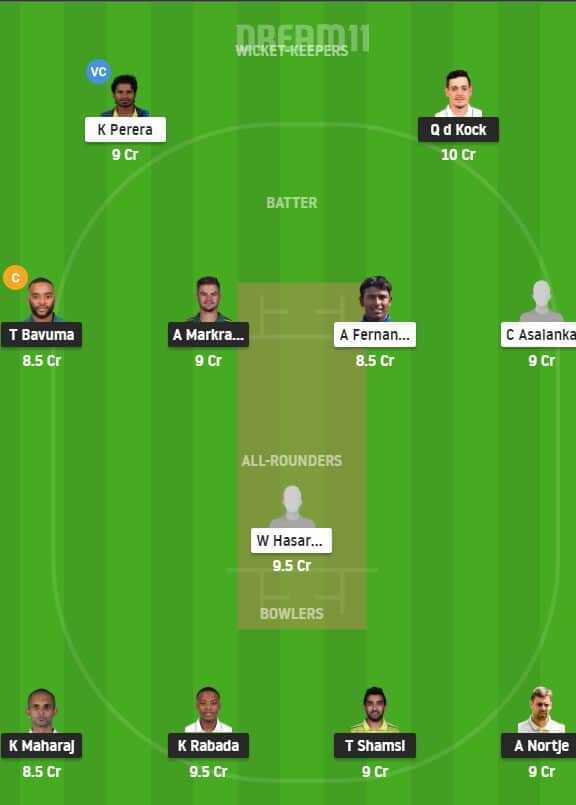
SA vs SL Dream11 Prediction: Possible Playing 11, Pitch Report, Dream11 Teams, Match Prediction For Match 25 of T20 WC 2021

The Match 25 of the T20 WC 2021 will be played on 30 October 2021 between South Africa and Sri Lanka at Dubai International Cricket Stadium, Dubai at 3:30 PM(IST).

You can watch live streaming of that match on Star Sports 1/1HD and Star Sports 1 Hindi/1 Hindi HD or you can even watch these matches on the Hotstar app (subscription required).

SA vs SL Teams and Match Preview:

South Africa: The team led by Temba Bauvma (Their first-ever black captain) is not among the favourites to grab the title.

They are currently ranked in the 3rd position in their group with 1 win in 2 matches.

However, They have a balanced squad with quality spinners, a great pace bowling attack and also have a combination of classy batsmen and power hitters.

SA is coming in this match after their easy win against defending champions West Indies by 8 wickets.

They wanted to win this match to be active in the race of reaching the semi-finals.

Sri Lanka: The team led by Dasun Shanaka is going through their worst phase.

The champions of the 2014 T20 WC have to play qualifiers this year to be part of Super 12.

Their spin bowlers are their main strength in this tournament so far along with some support from Charith Asalanka in the batting department.

They are coming in this match after a humiliating loss against AUS by 7 wickets.

However, their spin bowling can do wonders against SA if their batsman performed up to the mark.

SA vs SL Pitch Report:

The T20 WC 2021 is clearly dominated by the chasing teams, as they managed to win 9 games out of 10 (In the Super-12)

The only game in which the team batting first wins in the Super-12 stage is the game between AFG and SCO where AFG are simply way better than their rivals.

In the 5 matches played on this pitch in T20 WC 2021 (Including qualifiers), 4 were won by the team chasing and the only 1 exception was the above-mentioned AFG vs SCO match.

This pitch also generally supports spinners which means teams who played spin better will surely get an edge on this venue.

The 1st innings score in the last 5 matches on this venue is 125, 44, 171, 190,134.

Note: SL has won both their games at this venue in this T20 WC.

SA vs SL Weather Forecast:

Sunny and clear weather is expected for this match. The afternoon game generally helps spinners (especially in the second innings).

The humidity level should be around 40 % during this match with the average temperature being around 32 degrees Celsius.

SA vs SL Probable Playing 11:

South Africa: Temba Bavuma (c), Quinton de Kock (wk), Rassie van der Dussen, Aiden Markram, Reeza Hendricks/Heinrich Klassen, David Miller, Dwaine Pretorius, Keshav Maharaj, Kagiso Rabada, Anrich Nortje, Tabraiz Shamsi

Death Bowlers: Kagiso Rabada and Anrich Nortje

Sri Lanka: Kusal Perera (wk), Pathum Nissanka, Charith Asalanka, Avishka Fernando, Bhanuka Rajapaksa, Wanindu Hasaranga, Dasun Shanaka (c), Chamika Karunaratne, Dushmantha Chameera, Lahiru Kumara, Maheesh Theekshana

Death Bowlers: Dushmantha Chameera and Lahiru Kumara

SA vs SL Important Players:

Wanindu Hasaranga: He is easily the best spin all-rounder currently in this format.  

Will give you proper 4 overs and also get batting in 95%of matches due to SL’s weak batting lineup.

SA is not well renowned for playing spin which is also a plus point for a player like Hasaranga.

Fact: He is the only player to score a 50 and take more than 5 wickets in this T20 WC.

Tabraiz Shamsi: The no.1 T20i bowler in ICC rankings is a must-try in your small leagues.

He is also the highest wicket-taker in t20i this year by taking 29 wickets in 18 innings with an avg of 13.17.

However, as Asians, SL plays spin very well compared to other countries. This is the reason you can drop him if you are playing bigger leagues (In terms of members).

Aiden Markram: No player in recent times has improved his game as much as Markram.

He used to struggle against spin a lot, but nowadays he is maybe one of the best players of spin bowling in this team.

Nowadays, He is also giving 1-2 overs regularly and he can even take wickets against the fragile batting lineup of SL.

He is also the highest scorer of his team in T20i (In 2021) with 499 runs in 13 innings with a strike rate of 149.

Quinton De Kock: The man in the golden form is easily the best pick in wicket keeping section for this match.

He has scored 462 runs in just 11 innings with an average of 51 and a strike rate of 133 in t20i (In 2021)

After not playing the last match due to some controversy, De Kock is expected to play this match.

His struggle against quality spin in recent times makes him not a perfect choice of captaincy that too against a spin-dominating team.

Note: He can also give you some additional wicket-keeping points.

SA vs SL Players Stats At This Venue (In T20i Cricket):

Charith Asalanka: 86 runs in 2 matches

Bhanuka Rajapaksa: 53 runs in 2 matches

Kusal Perera: 34 runs in 2 matches

Avishka Fernando: 2 runs in 2 matches

Pathum Nissanka: 12 runs in 2 matches

Wanindu Hasaranga: 6 runs + 3 wickets in 2 matches

Lahiru Kumara: 4 wickets in 2 matches

Maheesh Theekshana: 2 wickets in 1 match

Chamika Karunaratne: 1 wicket in 2 match

Dushmantha Chameera: 1 wicket in 2 matches

SA vs SL Players H2H Stats In T20i:

Aiden Markram: 87 runs + 4 wickets in 5 matches

Rassie van der Dussen: 98 runs in 4 matches

Reeza Hendricks: 311 runs in 8 matches

Quinton De Kock: 260 runs in 10 matches

David Miller: 222 runs in 13 matches

Henrich Klassen: 20 runs in 4 matches

Charith Asalanka: 20 runs in 2 matches

Bhanuka Rajapaksa: 25 runs in 3 matches

Kusal Perera: 166 runs in 7 matches

Avishka Fernando: 40 runs in 5 matches

Wanindu Hasaranga: 8 runs + 3 wickets in 3 matches

Dasun Shanaka: 80 runs + 1 wicket in 5 matches

Chamika Karunaratne: 54 runs + 0 wickets in 3 matches

Kagiso Rabada: 5 wickets in 5 matches

Dwaine Pretorius: 87 runs + 3 wickets in 5 matches

Tabraiz Shamsi: 8 wickets in 6 matches

Anrich Nortje: 2 wickets in 2 matches

Keshav Maharaj: 3 wickets in 3 matches

Maheesh Theekshana: 1 wicket in 3 matches

Dushmantha Chameera: 1 wicket in 3 matches

SA vs SL Player Matchups of the Last 5 Years (Batsman vs Bowlers):

Reeza Hendricks vs Wanindu Hasaranga: 21 balls faced, 21 runs scored, 2 wickets

Quinton de Kock vs Wanindu Hasaranga: 32 balls faced, 40 runs scored, 1 wicket

Aiden Markram vs Dasun Shanaka: 4 balls faced, 4 runs scored, 1 wicket

Avishka Fernando vs Kagiso Rabada: 15 balls faced, 16 runs scored, 1 wicket

Faf du Plessis vs Axar Patel: 35 balls faced, 35 runs scored, 2 wickets

Charith Asalanka vs Aiden Markram: 4 balls faced, 3 runs scored, 1 wicket

Charith Asalanka vs Tabraiz Shamsi: 12 balls faced, 9 runs scored, 1 wicket

Kusal Perera vs Aiden Markram: 8 balls faced, 3 runs scored, 1 wicket

Kusal Perera vs Kagiso Rabada: 17 balls faced, 29 runs scored, 1 wicket

Kusal Perera vs Keshav Maharaj: 11 balls faced, 11 runs scored, 1 wicket

Safe Players For CAP/VC In Your Dream11 Teams(In Small Leagues):

Quinton de Kock

Kagiso Rabada (If SA bowls first)

Anrich Nortje

Wanindu Hasaranga (If SL bowls second)

Risky Players For CAP/VC In Your Dream11 Teams(In Grand Leagues):

Keshav Maharaj (If SA bowls second)

Temba Bauvma

Kusal Perera

Avishka Fernando

SA vs SL Dream 11 Teams:

Safe Team (For small leagues of up to 4 members)

Risky Team (From 7 members leagues to Grand leagues)

Note: This is not our final team. Our final team will be given on your telegram channel “Clan For Gamers“. If the link is not working in your case, You can simply copy the link and paste it into your telegram search bar

SA vs SL Match Prediction:

South Africa is expected to win this match.

Note: Don’t forget to share this article on different social media platforms.

SA vs WI Dream11 Prediction: Possible Playing 11, Pitch Report, Dream11 Teams, Match Prediction For Match 18 Of T20 WC 2021

The Match 18 of the T20 WC 2021 will be played on 26 October 2021 between South Africa and West Indies at Dubai International Cricket Stadium, Dubai at 7:30 PM(IST).

You can watch live streaming of that match on Star Sports 1/1HD and Star Sports 1 Hindi/1 Hindi HD or you can even watch these matches on the Hotstar app (subscription required).

SA vs WI Teams and Match Preview:

South Africa: The team led by Temba Bauvma (Their first-ever black captain) is not among the favourites to win this T20 WC as per some experts.

However, They have a balanced squad with quality spinners, a great pace bowling attack and also have a combination of classy batsmen and power hitters.

SA is coming in this match after their defeat in the first match against AUS due to their batting failure as they only managed to score 118 runs in 20 overs.

However, they have done pretty well in practice matches, as they managed to chase 186 against the PAK bowling lineup.

They wanted to win this match to be active in the race to reach the semi-finals.

West Indies: One of the greatest T20 players, Kieron Pollard, is leading his national team for the first time in any ICC event.  

They came into this tournament as hot favourites as they are the most successful team in the history of T20 WC.

However, they were thrashed by opposition teams in their last 3 T20 matches (PAK, AFG and ENG). WI just managed to score 55 in their last match against ENG 

Their batsman also got failed in warm-up games. They just managed to score just 82 runs in 24.2 overs and gave 10 wickets against spin bowlers in their last 3 T20 games.

Pollard wants his batsmen to step up in this match, As losing this match can almost nullify their chances to reach the semi-finals.

SA vs WI Pitch Report:

In 63 T20i matches played on this venue, the average 1st innings score is just 144.

Out of that 63 t20i matches, 34 matches were won by the team batting first (29 matches were won by the team batting second). 

In the 20 T20i matches played on this venue in the last 3 years, 15 were won by the team batting first, and the average first innings score is 154.

In the last 3 years, 64% of wickets on this venue were taken by fast bowlers and the rest 36% by spinners.

However in the 13 matches played on this venue in IPL 2021, we witnessed an average score of 15 and also 9 matches are won by the team chasing on this venue.

SA vs WI Weather Forecast:

Sunny and clear weather is expected for this match. The afternoon game generally helps spinners. The humidity level should be around 45 % during this match, with the average temperature being around 33 degrees Celsius.

SA vs WI Probable Playing 11:

South Africa: Temba Bavuma (c), Quinton de Kock (wk), Rassie van der Dussen, Aiden Markram, Reeza Hendricks/Heinrich Klassen, David Miller, Wiaan Mulder, Keshav Maharaj, Kagiso Rabada, Anrich Nortje, Tabraiz Shamsi

Death Bowlers: Kagiso Rabada and Anrich Nortje

West Indies: Lendl Simmons, Evin Lewis, Chris Gayle, Roston Chase/Shimron Hetmyer, Nicholas Pooran (wk), Kieron Pollard (c), Andre Russell, Dwayne Bravo, Akeal Hosein, Obed McCoy, Ravi Rampaul

Death Bowlers: Dwayne Bravo and Obed McCoy/Andre Russell

SA vs WI Important Players:

Evin Lewis: One of the most destructive openers in T20 cricket is going through a great form in 2021.  

He has smashed 390 runs in 14 innings with a strike rate of 163 in T20i cricket in 2021

Lewis was also the best batsman in CPL 2021, scoring 426 runs in just 11 innings with a strike rate of 163.

Fact: No other player from his team has scored more runs than him in T20i cricket in 2021.

Tabraiz Shamsi: The no.1 T20i bowler in the ICC rankings should be your first pick in the bowling section for this match. 

He is also the highest wicket-taker in T20Is this year, taking 29 wickets in 18 innings for an average of 13.17.

Shamsi was also the man of the series in the T20i series against WI in 2021.

As we have already discussed, West Indies batsman spin woes in the Match Preview section. Shamsi can take huge advantage of that.

Andre Rusell: A fully fit Russell is another must-have pick for your small-league teams for this match.

He can give you some crucial runs with his hitting ability and wickets in middle/death overs.

Although his form recently is not that great as well as his fitness. Still, on his day he can even smash a 25-ball fifty and take 3 wickets in a single match.

Quinton De Kock: The man in the golden form is easily the best pick in the wicketkeeping section for this match.

He has scored 462 runs in just 11 innings with an average of 51 and a strike rate of 133 in t20i (In 2021)

De Kock was also the highest scorer in the SA vs WI T20i series in 2021, scoring 255 runs in 5 innings with a strike rate of 141. (No other player in that series crossed the 200 runs mark)

Note: He can also give you some additional wicket-keeping points.

SA vs WI Players Stats At This Venue(In T20i Cricket):

Quinton De Kock: 78 runs in 2 matches

David Miller: 4 runs in 2 matches

Kieron Pollard: 33 runs in 3 matches

Evin Lewis: 10 runs in 3 matches

Chris Gayle: 13 runs in 1 match

Dwayne Bravo: 78 runs + 1 wicket in 3 matches

Akeal Hosein: 2 wickets in 1 match

Ravi Rampaul: 1 wicket in 1 match

SA vs WI Players H2H Stats In T20i:

Chris Gayle: 363 runs + 3 wickets in 11 matches

Quinton De Kock: 302 runs in 6 matches

Lendl Simmons: 198 runs in 5 matches

Evin Lewis: 178 runs in 5 matches

Dwayne Bravo: 152 runs + 15 wickets in 15 matches

Kieron Pollard: 146 runs + 5 wickets in 11 matches

Nicholas Pooran: 72 runs in 5 matches

Shimron Hetmyer: 57 runs in 3 matches

Andre Russell: 98 runs + 7 wickets in 9 matches

Obed McCoy: 9 wickets in 5 matches

Ravi Rampaul: 1 wicket in 2 matches

David Miller: 157 runs in 9 matches

Reeza Hendricks: 132 runs in 6 matches

Aiden Markram: 113 runs in 3 matches

Rassie van der Dussen: 97 runs in 5 matches

Temba Bavuma: 76 runs in 5 matches

Kagiso Rabada: 8 wickets in 7 matches

Tabraiz Shamsi: 7 wickets in 5 matches

Anrich Nortje: 4 wickets in 4 matches

Safe Players For CAP/VC In Your Dream11 Teams (In Small Leagues):

Quinton de Kock

Kagiso Rabada (If SA bowls first)

Anrich Nortje (If SA bowls first)

Evin Lewis 

Risky Players For CAP/VC In Your Dream11 Teams (In Grand Leagues):

Keshav Maharaj (If SA bowls second)

Obed McCoy (If WI bowls first)

Tabraiz Shamsi (If SA bowls second)

SA vs WI Dream 11 Teams:

Safe Team (For small leagues of up to 4 members)

Risky Team (From 7 members leagues to Grand leagues)

Note: This is not our final team. Our final team will be given on your telegram channel, “Clan For Gamers“. If the link is not working in your case, You can simply copy the link and paste it into your telegram search bar

SA vs WI Match Prediction:

South Africa is expected to win this match.

Note: Don’t forget to share this article on different social media platforms.

The Greatest Test XI of the 2000s

Making this team is one of the most challenging tasks, as numerous legendary players played in this decade, and the hike of most cricketing nations was only in this decade.

We would not select the team solely based on raw numbers; instead, we would consider a mix of useful stats and the players’ impact.

The stats mainly comprise the SENA/I Records of batsmen, Asian records for pacers, etc. Also, a factor is the importance of the player’s contribution to the matches the team won.

The factors which every player of our team must fulfil are:

  • 5000+ Runs (For Batsman)
  • 200+ Wickets (For Bowler)

We are going ahead with a combination of five specialist batsmen, one batting all-rounder, one specialist Wicket Keeper, three pacers, and a spinner. We have selected One More Spinner as our 12th man.

As we discuss the team in detail, you may scroll down to the bottom if you are just interested in the final XI.

Graeme Smith

The South African player scored 6451 runs in the 79 matches at an average of 49.62 and has 18 tons to his name.

The opening is one of the most challenging tasks in South Africa, and having 40 plus average is considered good, but GC Smith has scored 2807 runs at an average of 43.18 in South Africa.

Graeme excelled in away matches, scoring 3644 runs at an average of 56.06 as an opener. He has also performed well in Asia, with 2 tons at an average of 48.96.

“South Africa Wins Matches When Smith Performs” was a fact, as Smith averaged a whopping 65.20 in the Matches won by SA, scoring 14 out of his 18 tons.

Smith’s presence would also be valuable as a leader. He is the only captain in Test history to captain a side for 100+ matches, so he is also the captain of our side.

  • Graeme Smith’s stats in the 2000s: 139 Innings, 6451 Runs, 49.62 Average, 18 Centuries
  • Graeme Smith’s stats away from home in the 2000s: 70 Innings, 3644 Runs, 56.06 Average, 11 Centuries
  • Graeme Smith’s stats in IENA in the 2000s: 46 Innings, 2267 Runs, 53.97 Average, 6 Centuries
  • Graeme Smith’s stats in won matches in the 2000s: 63 Innings, 3782 Runs, 65.20 Average, 14 Centuries

Matthew Hayden

Matthew Hayden was one of the members of the most prolific opening pair of the 2000s, his partner being Justin Langer.

Matthew Hayden scored 8634 runs [i.e., most by an opener in the 2000s]

Hayden was a master whenever he played in Australia; this can be stated by the fact that he averaged nearly 60 while playing in his home country, but somehow, his average dipped to 45 when he opened the innings away from Australia.

Most of the Australian players found it difficult to score in India. Still, Hayden averaged more than 51 in India, and against India (i.e., BG Trophy), he averaged an astonishing 59.21, but he was mediocre in England And New Zealand with averages of 35 and 29, respectively.

Hayden scored 22 of his 29 Tons when Australia won the match; it depicted Australia’s performance when he performed.

Fact: Hayden has the record for hitting the most sixes (81) in the decade.

  • Matthew Hayden’s stats in the 2000s: 172 Innings, 8364 Runs, 52.93 Average, 29 Centuries
  • Matthew Hayden’s stats away from home in the 2000s: 79 Innings, 3331 Runs, 45.63 Average, 9 Centuries
  • Matthew Hayden’s stats in SENI in the 2000s: 58 Innings, 2316 Runs, 42.88 Average, 5 Centuries
  • Matthew Hayden’s stats in won matches in the 2000s: 119 Innings, 5975 Runs, 55.84 Average, 12 Centuries

Rahul Dravid

The next man on our team is the Indian Wall, Mr Rahul Dravid.

In total, he scored 8558 runs in 103 matches he played at an average of 55.

Most Indian batsmen found it difficult to score in England, but it was not the same for The Wall, who averaged 56+ in England. Rahul was excellent in every country, averaging above 56 in away conditions, three more than his home average.

In a total of 10 years, Dravid averaged 60+ 5 times. Moreover, Dravid was one of the most dependable batsmen of Captain Sourav Ganguly, as, under him, he averaged an astonishing 73.31 in 49 matches.

Dravid was involved in one of the most significant test partnerships ever with VVS Laxman, i.e., 376 runs in 2001 against Australia at Kolkata.

India never lost a test match when Rahul Dravid scored a ton in the 2000s; his 11 came in won matches while the other 11 were in the draw.

Fact: Rahul Dravid faced the most deliveries in the decade.

  • Rahul Dravid’s stats in the 2000s: 179 Innings, 8558 Runs, 54.85 Average, 22 Centuries
  • Rahul Dravid’s stats away from home in the 2000s: 100 Innings, 4875 Runs, 56.03 Average, 11 Centuries
  • Rahul Dravid’s stats in SENA in the 2000s: 52 Innings, 2308 Runs, 50.17 Average, 4 Centuries
  • Rahul Dravid’s stats in won matches in the 2000s: 63 Innings, 3810 Runs, 74.70 Average, 11 Centuries

Sachin Tendulkar

The next player in our team is labelled as the God of Cricket Mr Sachin Ramesh Tendulkar.

Sachin scored 7129 runs in the decade at an average of 53.20.

Like Dravid only, Sachin was incredible in away tests with an average near 54, nearly two runs per match better than his home average.

Sachin was famous for smashing Australia in Australia, averaging 66+ there with 3 tons.

A remarkable fact is that Sachin was excellent in the 4th test match of the series (mostly decider) as he averaged 87.75 with 3 tons.

There is a common myth that Sachin used to play for his 100(s), and those 100(s) don’t benefit the team, but 12 of his tons in the 2000s were scored in won matches.

Sachin got an edge on Kumara Sangakarra and Mohammad Yousuf just because of his uniform numbers; they both have better overall records but failed miserably in some countries, whereas Sachin was equally good everywhere.

  • Sachin Tendulkar’s stats in the 2000s: 150 Innings, 7129 Runs, 53.20 Average, 21 Centuries
  • Sachin Tendulkar’s stats away from home in the 2000s: 79 Innings, 3839 Runs, 54.07 Average, 11 Centuries
  • Sachin Tendulkar’s stats in IENA in the 2000s: 48 Innings, 2390 Runs, 54.31 Average, 6 Centuries
  • Sachin Tendulkar’s stats in won matches in the 2000s: 56 Innings, 3163 Runs, 67.29 Average, 12 Centuries

Ricky Ponting

The player to lead the invincible Aussies is the next in our team. Ricky Ponting is the highest scorer in the decade, with 9458 runs at a GOD-level average of 58.38.

From Australia to New Zealand and from Bangladesh to Zimbabwe, Punter scored everywhere against each nation, but India was the only country where Punter failed miserably. Here, Ponting could manage just 306 runs in 8 matches with a meagre average of 21.85.

Just Like Rahul Dravid, Ponting, too, managed an average of 60+ five times in the decade. 

Punter, too, was a batsman who significantly contributed to making the Aussies Invincible. He averaged 65.21 in won matches and scored 24 of his 32 tons in the same.

Fact: Along with the most runs, Punter also has the most fours(1102) and most 100(s) [32] in the decade.

  • Ricky Ponting’s stats in the 2000s: 184 Innings, 9458 Runs, 58.32 Average, 32 Centuries
  • Ricky Ponting’s stats away from home in the 2000s: 85 Innings, 4125 Runs, 51.56 Average, 15 Centuries
  • Ricky Ponting’s stats in IENA in the 2000s: 61 Innings, 2548 Runs, 43.93 Average, 8 Centuries
  • Ricky Ponting’s stats in won matches in the 2000s: 122 Innings, 6703 Runs, 65.71 Average, 24 Centuries

Jacques Kallis

What would be your reply if someone asked you about the greatest batting all-rounder of all time? I can’t think of a third other than Sir Garfield Sobers or Jacques Kallis. The latter is part of our team and has scored 8630 runs (second-most in the decade) and has 27 tons to his name.

Kallis is good anywhere in the world, including India, except in England, where he averaged just 22.46. His away average of 53+ depicts his quality. Kallis could be part of this XI solely on his batting record.

Kallis has 15 of his 27 tons in matches RSA won, with an average of nearly 70.

In his bowling, he has 205 wickets, a good bowling average of 32.00, and a total of 4 fifers, including a fifer in Bangladesh (Asia).

Fact: Kallis has the highest batting average (58.70) in the 2000s among players with 2000+ runs in the 2000s. 

  • Jacques Kallis’ stats in the 2000s: 174 Innings, 8630 Runs, 58.70 Average, 27 Centuries
  • Jacques Kallis’ stats away from home in the 2000s: 88 Innings, 3860 Runs, 53.61 Average, 11 Centuries
  • Jacques Kallis’ stats in IENA in the 2000s: 48 Innings, 1911 Runs, 45.50 Average, 4 Centuries
  • Jacques Kallis’ stats in won matches in the 2000s: 75 Innings, 4259 Runs, 69.67 Average, 11 Centuries
  • Jacques Kallis’ bowling stats in the 2000s: 174 Innings, 205 Runs, 32.00 Average, 65.00 Strike Rate, 4 5W hauls

Adam Gilchrist (WK)

No one can think of a second name for a test wicketkeeper-batsman besides Adam Gilchrist.

He will always be the first name whenever an all-time test XI is selected.

Gilly scored 5,130 runs in the 2000s decade, averaging 46+ with 16 tons. He also has a good away average of 50+.

Like Punter, Gilly struggled in India, averaging only 25, but unlike Ponting, Gilly had a test series win in India as a captain in 2003-04. Gilly scored 13 of his 16 tons when Australia won the match.

Gilly played all of his 91 matches as a wicket-keeper and has 362 catches and 35 stumpings to his name.

  • Adam Gilchrist’s stats in the 2000s: 129 Innings, 5130 Runs, 46.63 Average,16 Centuries
  • Adam Gilchrist’s stats away from home in the 2000s: 62 Innings, 2512 Runa, 50.24 Average, 10 Centuries
  • Adam Gilchrist’s stats in SENI in the 2000s: 45 Innings, 1873 Runs, 48.02 Average, 7 Centuries
  • Adam Gilchrist’s stats in won matches in the 2000s: 89 Innings, 3892 Runs, 54.05 Average, 13 Centuries

Shaun Pollock

If we talked about the most accurate fast bowlers, Shaun Pollock would be there in the top 5. This man had great success in ODI(s) [In the top five all-time ODI players for me], but his greatness in tests is quite underrated as he is the second-best fast Bowler in the 2000s.

Pollock clinched 250 wickets with a good average of under 25. He had brilliant success all around the globe except in Australia, where he averaged 46+. His away average of 28 is also quite good.

Asian pictures are considered graveyards for fast bowlers, but if someone has control over his bowling, he could perform there too. This is the case for Shaun Pollock, who has 50 wickets in Asia with a good bowling average of nearly 23 with 1 fifer.

Talking about Pollock and ignoring his batting is no less than a sin. His batting numbers are pretty good, with an average of 32.56, and he also has 2 100(s) to his name.

In the matches where RSA won, Pollock averaged nearly 40 with the bat and 20 with the ball. So, in conclusion, Shaun Pollock is an absolute gem as a player.

  • Shaun Pollock’s stats in the 2000s: 135 Innings, 260 Wickets, 24.76 Average, 61.0 Strike Rate, 6 5W Hauls
  • Shaun Pollock’s stats away from home in the 2000s: 35 Innings, 122 Wickets, 28.36 Average, 68.1 Strike Rate, 3 5W Hauls
  • Shaun Pollock’s stats in Asia in the 2000s: 14 Innings, 50 Wickets, 23.18 Average, 58.2 Strike Rate, 2 5W Hauls
  • Shaun Pollock’s stats in won matches in the 2000s: 32 Innings, 131 Wickets, 20.22 Average, 52.8 Strike Rate, 2 5W Hauls
  • Shaun Pollock’s Batting stats in the 2000s: 100 Innings, 2377 Runs, 32.56 Average, 2 Centuries

Jason Gillespie

The next Bowler in our team is Australian “Dizzy”. In total, Gillespie played 57 matches in the decade, in which he clinched 209 wickets at a good bowling average of 27 and had 5 fifers.

His numbers in away matches are not much different, as he averages 29 with 3 fifers.

Gillespie was one of the most lethal fast bowlers in Asia, managing an excellent bowling average of nearly 23 in the 13 matches he played here.

Makhaya Ntini has taken way more wickets (he was the highest wicket-taker as a pacer in the 2000s) than Dizzy in the decade, but the factor favouring him is his consistency all around the globe. Due to this factor alone, Gillespie made it to our final 11, while Ntini could not.

His record in the won matches is excellent, with a bowling average of nearly 22.3, and also, all of his 5 fifers in the 2000s were in the won matches.

On some occasions, this bloke could handle the bat, too, as he scored 201* in the match against Bangladesh in 2005 while playing as a Nightwatchman. (highest score by a Nightwatchman in cricket history)

  • Jason Gillispie’s stats in the 2000s: 113 Innings, 209 Wickets, 27.09 Average, 57.4 Strike Rate, 5 5W Hauls
  • Jason Gillispie’s stats away from home in the 2000s: 62 Innings, 108 Wickets, 29.18 Average, 58.6 Strike Rate, 3 5W Hauls
  • Jason Gillispie’s stats in Asia in the 2000s: 26 Innings, 54 Wickets, 22.96 Average, 49.7 Strike Rate, 1 5W Haul
  • Jason Gillispie’s stats in won matches in the 2000s: 78 Innings, 159 Wickets, 22.28 Average, 48.9 Strike Rate, 5 5W Hauls

Glenn McGrath

If accuracy is the art, Pigeon is the artist. He was the most accurate fast Bowler, followed by Curtly Ambrose, Joel Garner, and Shaun Pollock. He is so freaking accurate that he can hit a coin on a pitch all day long.

Glenn McGrath has 297 wickets in the decade with a dream average of 20.53. He failed nowhere in the world, depicted by his away average of less than 20, approximately 2 less than his home average.

For all seven years he played in the decade, he tore away at the batsman with his accurate line and length, not sheer pace. 

His numbers in Asia are more than a fast bowler could have dreamt. In Asia, he had 45 wickets with an average of nearly 17.

Australia won 51 of the 66 matches he played, and here he averaged 18.06. 

So, undoubtedly, Pigeon is the best fast Bowler in test cricket in the 2000s

  • Glenn McGrath’s stats in the 2000s: 131 Innings, 297 Wickets, 20.53 Average, 51.4 Strike Rate, 14 5W Hauls
  • Glenn McGrath’s stats away from home in the 2000s: 58 Innings, 141 Wickets, 19.06 Average, 47.2 Strike Rate, 8 5W Hauls
  • Glenn McGrath’s stats in Asia in the 2000s: 20 Innings, 45 Wickets, 17.08 Average, 47.0 Strike Rate
  • Glenn McGrath’s stats in won matches in the 2000s: 102 Innings, 247 Wickets, 18.06 Average, 47.0 Strike Rate, 12 5W Hauls

Muttiah Muralitharan

Many spinners ruled the cricketing world in their respective era(s), but there is only one GOAT, and he is none other than Muttiah Muralitharan.

Shane Warne’s ball to Mike Gatting in the 1993 Ashes was termed the ball of the century, but deep inside, we all know that Murali delivered hundreds of balls like that.

His numbers justify his talent too. He has 565 wickets in the decade, averaging 20.97.

49 fifers in a decade are insane, with Harbhajan Singh from India being second best at 23. Murali also has 20 10-wicket hauls [Shane Warne at second with just 6].

He played 14 matches in SENA and has 77 wickets with a good average of 25.8 and 6 fifers.

32 of his 49 fifers were in the match that Sri Lanka won, and he averaged less than 16 in those matches.

At last, all thanks to his Captain, Arjuna Ranatunga, for saving young Murali’s career when the whole world was against him and Umpire Ross Emerson stopped him from bowling thrice in a short period.

  • Muttiah Muralitharan’s stats in the 2000s: 154 Innings, 565 Wickets, 20.97 Average, 50.9 Strike Rate, 49 5W Hauls
  • Muttiah Muralitharan’s stats away from home in the 2000s: 61 Innings, 201 Wickets, 26.36 Average, 56.6 Strike Rate, 14 5W Hauls
  • Muttiah Muralitharan’s stats in SENA in the 2000s: 23 Innings, 77 Wickets, 25.80 Average, 58.4 Strike Rate, 6 5W Hauls
  • Muttiah Muralitharan’s stats in won matches in the 2000s: 78 Innings, 333 Wickets, 15.49 Average, 40.6 Strike Rate, 32 5W Hauls

Shane Warne

Many cricket experts and the game audience consider Shane Warne the greatest spinner ever to play test cricket. Still, I can’t choose between Warne and Murali as a superior bowler.

Warne played mostly on Pace-friendly pitches, but Murali also performed well in these conditions. Murali outplayed Warne in the decade because of a high 208 wicket difference, and Murali’s stats are superior, too.

Warne clinched 357 matches in the decade with an average of 25 and 21 fifers. He played 35 of 65 games outside the home country, has 199 wickets in those with a better average of 24 and has 15 away fifers too.

Warne has played in Australia since childhood, so we are not considering his Australian record here. He has 138 wickets in SEN (South Africa, England, New Zealand) with a great average under 22 and 9 fifers.

Australia won 70% of the matches Warne played in the decade, and in those matches, he has 17 fifers and a bowling average near 23 with 283 wickets. 

The 2005 Ashes is considered one of the most remarkable test series ever. Still, many readers might not know that Warne was the highest wicket-taker in that Ashes, with 40 wickets. Taking 40 wickets in a five-match series, that too in England by a spinner, is insane.

  • Shane Warne’s stats in the 2000s: 127 Innings, 357 Wickets, 25.17 Average, 50.7 Strike Rate, 21 5W Hauls
  • Shane Warne’s stats away from home in the 2000s: 71 Innings, 226 Wickets, 22.65 Average, 44.3 Strike Rate, 17 5W Hauls
  • Shane Warne’s stats in ENA in the 2000s: 22 Innings, 138 Wickets, 21.95 Average, 43.4 Strike Rate-43.4, 9 5W Hauls
  • Shane Warne’s stats in won matches in the 2000s: 99 Innings, 283 Wickets, 23.37 Average, 48.0 Strike Rate, 17 5W Hauls

So, The Greatest Test XI of the 2000s is:

  1. Graeme Smith (C)
  2. Mathew Hayden
  3. Rahul Dravid
  4. Sachin Tendulkar
  5. Ricky Ponting
  6. Jacques Kallis
  7. Adam Gilchrist (WK)
  8. Shaun Pollock
  9. Jason Gillespie
  10. Muttiah Muralitharan
  11. Glenn McGrath

Shane Warne (12th Man)