What happened in the last 4-5 years in Test Cricket; There has to be a reason for the dip in batting performances; a 400+ score when 2 Top teams playing against each other is as rare as a fast-bowling all-rounder in India, maybe not that extreme, but still the batting numbers of batsman/teams are going downwards at a rapid pace.
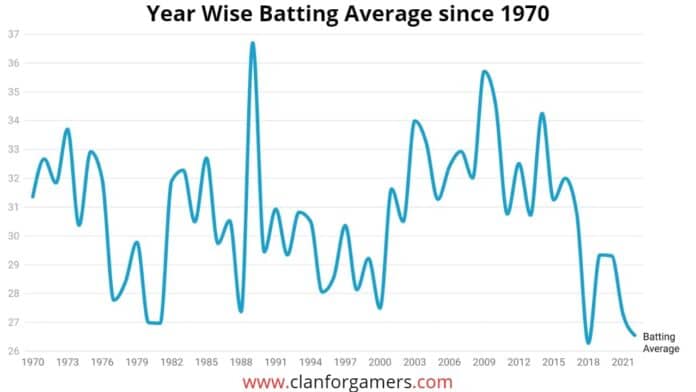
The level of decline is clearly visible in this chart; 2018 was the toughest year to bat in the last 50 years.
From 2001 to 2017, the mean batting average in Test cricket was higher than 30 each year; since 2018, not even a single year has touched the mark of 30.
Now, Some teams don’t have a single batsman in their lineup, whose Batting Average in Test cricket touches the mark of 50 (WI, ENG, SL, BAN, PAK, SA); NZ and IND have 1 player each; Aus have 2, in which Labuschagne is not much tested yet.
Once upon a time, in the earlier part of this century, every team used to have 1-2 players with a 50+ average and 1-2 batsmen with an average lying between 40-50.
So, what just happened?, Is the overall quality of batsmanship in Test cricket been reduced in the last 3 years? , maybe it can be said, for a team like West Indies. But with batting averages depleting everywhere in the world, there has to be something to justify why it is happening.
There can be many reasons for that; the increase in the quality of bowling lineups, particularly fast bowling attacks and the change in pitches are two of the most common and logical reasons.
Let’s discuss both of the reasons in a deeper manner.
Fast Bowling Attacks: Lethal and Deep
Batting in Test cricket is a secondary weapon; bowling is the primary.
In most circumstances in Test cricket, a team is just as good as its bowling attack, particularly its fast-bowling attack.
For example, a team of 5 world-class bowlers can say 5 Cummins, with 5 decent batsmen will beat a team of 5 Joe Root and 5 average bowlers in a Test match in most scenarios.
It significantly impacts the batting numbers of batsmen; a bowling attack of higher quality will obviously concede fewer runs than an average/poor bowling attack, even on the same surface against the same lineup. The difference in runs will depend on the difference in the quality of bowling attacks.
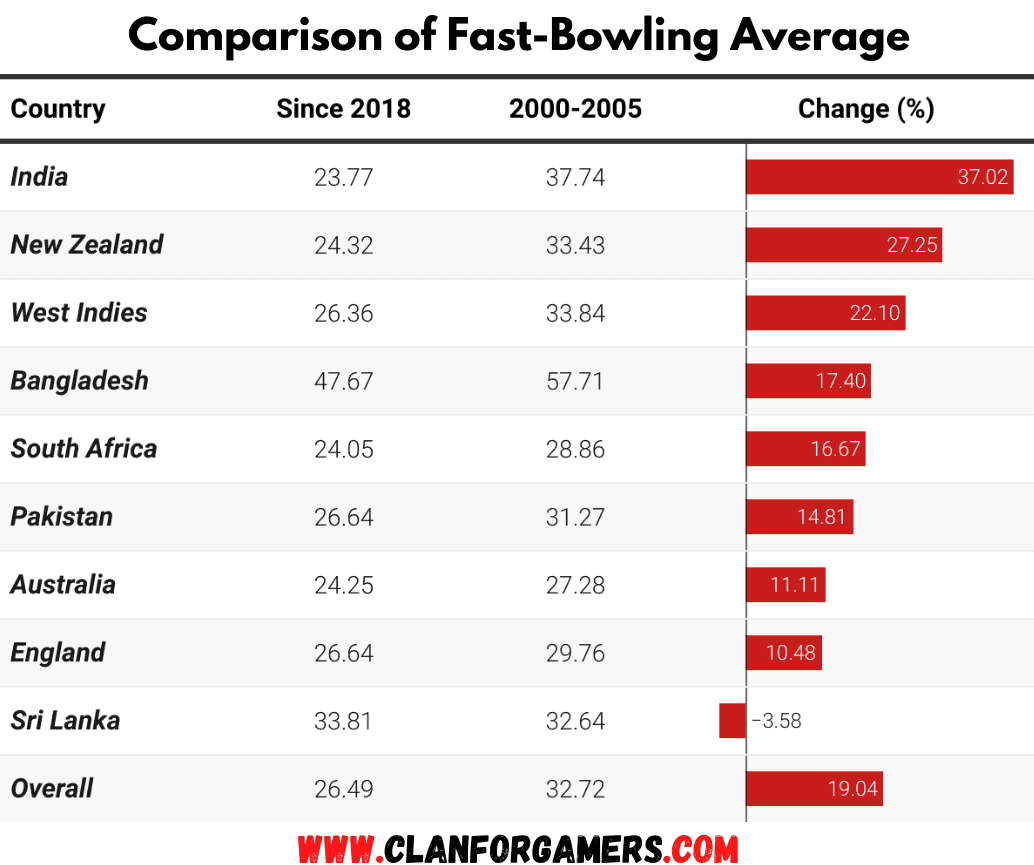
So we will compare the fast bowling attack of the existing era (2018-2022) with the bowling attack of 2000-2005; below is the country-wise fast-bowling comparison of every team in both periods.
Note: All the stats used in this are valid as of 21 Feb 2022.
Australia
Australia in the 2000-2005 period had a fast-bowling attack of Lee, Gillispie and McGrath, which looks more prominent in the initial view as compared to the current ones of Cummins, Hazlewood and Starc.
Regardless of that first look, statistically, the existing attack is better or just as good as the previous one; McGrath of 2000-2005 was exceptional; the same goes with Cummins as he averages less than 20 in the other period.
Starc, if not better, is as good as Lee; the matter of Hazelwood and Gillespie is also similar in our selected span.
- Runs Per Wicket by Aus Pacers in 2000-2005:27.28
- Runs Per Wicket by Aus Pacers since 2018:24.25
It will even go slightly worse if we compare their pace attacks when the three lead pacers played together; the attack led by McGrath gave 28.46 runs per wicket, and Cummins one just gave 24.69.
New Zealand
Shouldn’t waste a second of time here in comparison; the current Pace attack of Southee, Wagner, Boult and Jamieson is way apart from Martin, Cairns, Tuffey, and Bond.
The previous pace attack was at max decent, which is why 12 pacers in that era bowled more than 100 overs compared to 5 in the ongoing one.
Just 1 pacer Shane Bond can come into the current bowling lineup of NZ; however, any of the 4 pacers of the current attack will walk into the previous side of NZ easily and that too is the second-best bowler of that attack.
- Runs Per Wicket by NZ Pacers in 2000-2005: 33.43
- Runs Per Wicket by NZ Pacers since 2018-:24.32
Stats say that the current attack will dismiss his opponents on an average score of 243, 91 runs less than what a 00-05 attack would have given for the same task.
India
The case of India lies in the same bracket as New Zealand; the current Indian fast-bowling attack is not just better than the 00-05 era one; it is by far the best Indian fast-bowling attack ever. “The only world-class fast-bowling attack India have in their Test history”.
In the current attack of Shami, Bumrah, Ishant and Umesh, Shami has the highest average (24.08); not to surprise that even after being the worst of the 4, that number is still better than all the 14 pacers bowled for India in the 2000-2005 period.
The three main pacers (Bumrah, Shami and Ishant) of the current team can walk into the bowling attack of 2000-2005 as lead bowlers of that attack.
- Runs Per Wicket by Indian Pacers in 2000-2005:37.74
- Runs Per Wicket by Indian Pacers since 2018:23.77
The difference of almost 14 runs per wicket is self-explanatory, and it justified all the points mentioned above, maybe showing more than what I described.
West Indies
West Indies’ story in the early part of this century was not ideal; Walsh took 93 wickets for them, the second-most in the selected period; but he just played 1 and a half years; Ambrose played even less than that.
In the current attack, 2 Bowlers; Holder and Roach averages less than 25; just one bowler (Walsh) from the previous attack averages less than 25 with at least 500 overs bowled.
Even if we keep his batting skills aside, Holder could have played in the previous bowling lineup of Dillon, Collymore, Collins and Edwards. The same goes for Roach.
- Runs Per Wicket by West Indian Pacers in 2000-2005: 33.84
- Runs Per Wicket by West Indian Pacers in 2018: 26.36
Sri Lanka
Sri Lanka is the only team in which the quality of fast bowling got more powerless compared to the previous period.
Chaminda Vaas, by far the best fast-bowler produced by his country, was the lead bowler of the 00-05 fast-bowling attack of Sri Lanka (193 wickets with an average of less than 30).
On the other hand, Lakmal was the lead bowler during the current era, taking 72 wickets with an average of less than 25 to justify the given tag. However, the support he gets from other pacers from his side is quite mediocre as all the other ones average above 30 in the interval, some even above the mark of 35.
- Runs Per Wicket by Sri Lankan Pacers in 2000-2005: 32.64
- Runs Per Wicket by Sri Lankan Pacers since 2018: 33.81
England
England has an attack of Hoggard, Flintoff, Harmison and Caddick in the starting 5 years of this century, with Gough and Jones just behind them in the wickets tally. If we compare it to the current attack of Anderson, Broad, Woakes, Wood, and Stokes, the numbers will deviate the pendulum towards the current one.
Anderson since 2018, is much better than any English Pacer version of 00-05; nearly the same goes with Broad; both have picked up more than 100 wickets with an average of less than 25, while on the other side, the 6 pacers with at least 50 wickets in the prior period have an average of 30.07,30.89, 28.71, 30.21, 27.42, 28.23.
- Runs Per Wicket by England Pacers in 2000-2005: 29.76
- Runs Per Wicket by England Pacers since 2018: 26.64
South Africa
Pollock, Ntini, Kallis and Nel are the top 4 wicket-takers for SA in the primary time of this century; Rabada, Philander, Ngidi and Nortje are the ones in the other.
Pollock was deadly in the previous period, used to take a wicket for every 23 runs conceded or 60 balls bowled; Rabada, the leader of the current attack, just gives the same amount of runs per wicket but he is getting a wicket in every 43 balls in the current era.
Going with their numbers, both will give almost the same runs to take 10 wickets (Rabada will give 8 less though) but Rabada will do this in 72 overs, compared to Pollock’s 100 overs.
Now, Philander, Ngidi and Nortje (23.59) formed a better attack than Kallis, Ntini and Nel (29.74), a special thanks to Kallis’s average of 33 in the duration.
- Runs Per Wicket by South African Pacers in 2000-2005: 28.86
- Runs Per Wicket by Proteas Fast-Bowlers since 2018: 24.05
Pakistan
Shoaib Akhtar in the first 5 years of this century was a nightmare for the batsmen; he was better than any of Pakistan’s current Test bowlers in terms of performances in our selected periods.
Akhtar averages around 20 and strikes in every 37 balls, but the support he got was the reason that the current attack of Pak is much better, which will be proved by the numbers themselves.
Waqar, Razzaq and Sami are the supporting cast for Akhtar; these 3 bowlers average 27.91, 36.74, and 46.12 in the period. On another side, the 3 main pacers of the current attack (Shaheen, Hasan and Abbas) average 23.89, 23.59 and 21.07 since 2018.
- Runs Per Wicket by Pakistan Pacers in 2000-2005: 31.27
- Runs Per Wicket by Pakistan Pacers since 2018: 26.64
Bangladesh
On 10 Nov 2000, The Team of Tigers played their first test under the captaincy of Naimur Rahman; they lost it by 9 wickets, almost 4 years later (10 Jan 2005); they won their first Test, which remained the only test match they won in our selected period (2000-2005) out of 40.
In an ideal scenario, to win all 40 matches, they should have taken 800 wickets, but they got just 348.
In terms of pace bowling in their attack, not a single pacer has picked up at least 50 wickets for Bangladesh in Test cricket in both periods. All the pacers combined have taken fewer than 100 Test wickets since 2018.
- Runs Per Wicket by Bangladesh Pacers in 2000-2005: 57.71
- Runs Per Wicket by Bangladesh Pacers since 2018: 47.67
The team that just picked 348 wickets in its first 40 tests (9 wickets per match), has now taken 334 wickets in 24 matches (14 wickets per match) since 2018. A major reason for the spike of win% from 2.5 % to 25%.
The deep demonstration of fast-bowling attacks from all the teams in both eras is over; only Sri Lanka has declined in terms of fast-bowling attack quality; Aus, Pak, Eng, SA and WI fast bowling attack has remained almost as good as the previous one or improved; Ban, NZ and Ind attacks got much more lethal and deep.
So the current era has much better fast-bowling attacks and much deeper, at least the numbers show that!!
- Runs Per Wicket by Pacers in 2000-2005: 32.72
- Runs Per Wicket by Pacers since 2018: 26.49
Changes in Pitches: The Journey From Roads to Results
Pitches offered during the period of 2000-2005 are considerably more supportive of batsmen than pitches presented in Test cricket since 2018.
Those pitches were neither better for the general viewers of the game; an average person who spends his 5 days of infinite worth should have a feeling at the end, either satisfaction (if his team won) or disappointment (in the opposite scenario), simply for the growth of viewers in test cricket, test cricket should end in either favour.
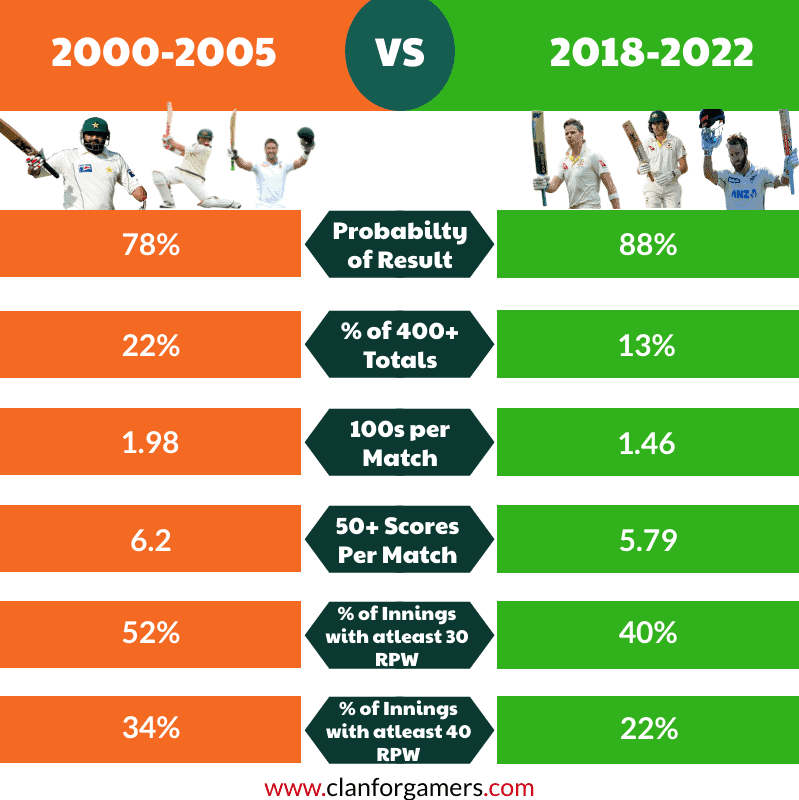
This is what has been happening since 2018. The chart below shows that the probability of a decisive result in a test match (in the favour of a team) has increased by around 13%.
For improvement, some have to sacrifice; batsmen are “some” in this case. They have to sacrifice by paying the price for much more bowling-friendly wickets than the batsmen of previous generations.
The chart below shows that every metric related to batting just declined at a more than decent rate, with less 400+ scores, a 26% decrease in hundred(s) per match, and each and every number which quantifies batting has declined.
The result of which is that their batting numbers will not be as high as the previous ones, even if the two batsmen are equally good.
There are 25% of batsmen with 1000+ runs used to average 50 or higher during 2000-2005; if we slightly lower our criteria to 40, 55% of batsmen will fulfil it.
However, since 2018, just 40% of batsmen with 1000+ runs, average more than 40, and just 11% average more than 50. So the chances of being a batsman with 1000 Test runs with an average of 50 since 2018 are 56% less than what they were in the 2000-2005 time frame.
That’s it, the explanation of both the reasons are given, and the verdict is simple: Current batsman averaging less in the longest form of cricket as compared to some batsmen of the recent past is because of playing against better and much deeper bowling attacks and playing on pitches which are prepared for results, not for batsmanship!!
Hope you liked this article, as usual, share it on social media platforms and share your opinions regarding this article or your own reasons for the depletion of batting averages in the comment section.


